Estimated Value: $202,368 - $256,000
--
Bed
1
Bath
1,724
Sq Ft
$137/Sq Ft
Est. Value
About This Home
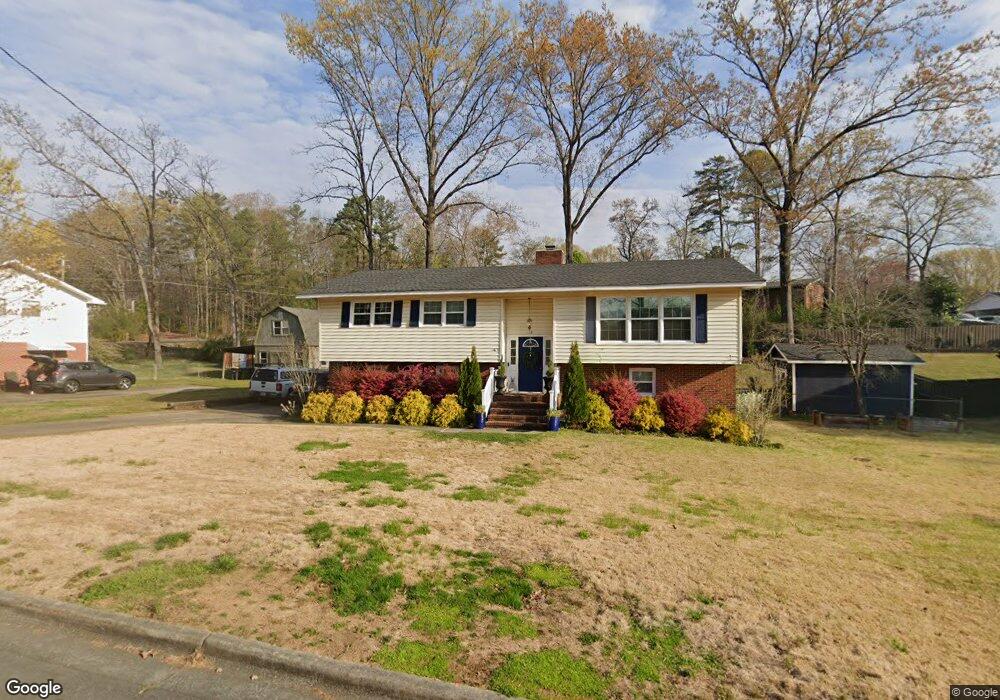
This home is located at 18 Wilson Dr SW, Rome, GA 30165 and is currently estimated at $236,342, approximately $137 per square foot. 18 Wilson Dr SW is a home located in Floyd County with nearby schools including Rome High School.
Ownership History
Date
Name
Owned For
Owner Type
Purchase Details
Closed on
May 6, 2008
Sold by
Not Provided
Bought by
Warren Heather Michelle and Minor Children Kendall
Current Estimated Value
Purchase Details
Closed on
Nov 6, 2001
Bought by
P and R
Purchase Details
Closed on
Apr 6, 2000
Sold by
Warren Stacy
Bought by
Warren Spencer M
Purchase Details
Closed on
Jan 27, 2000
Sold by
Warren Spencer M
Bought by
Warren Stacy
Purchase Details
Closed on
Jan 24, 2000
Sold by
Warren Stacy
Bought by
Warren Spencer M
Purchase Details
Closed on
Nov 1, 1999
Sold by
Warren Heaven and Stacy Warren
Bought by
Warren Stacy
Purchase Details
Closed on
Oct 7, 1997
Sold by
Walker Larry B
Bought by
Warren Heaven and Stacy Warren
Purchase Details
Closed on
Oct 1, 1997
Sold by
Walker Larry B and Walker Vicki J
Bought by
Walker Larry B
Purchase Details
Closed on
Aug 28, 1995
Bought by
P and R
Purchase Details
Closed on
May 25, 1990
Sold by
Meade Richard K
Bought by
Walker Larry B and Walker Vicki J
Purchase Details
Closed on
Jul 29, 1988
Bought by
Meade Richard K
Create a Home Valuation Report for This Property
The Home Valuation Report is an in-depth analysis detailing your home's value as well as a comparison with similar homes in the area
Home Values in the Area
Average Home Value in this Area
Purchase History
| Date | Buyer | Sale Price | Title Company |
|---|---|---|---|
| Warren Heather Michelle | -- | -- | |
| Warren Heather Michelle | -- | -- | |
| P | -- | -- | |
| Warren Spencer M | $95,500 | -- | |
| Warren Stacy | -- | -- | |
| Warren Spencer M | -- | -- | |
| Warren Stacy | -- | -- | |
| Warren Heaven | $89,000 | -- | |
| Walker Larry B | -- | -- | |
| P | -- | -- | |
| Walker Larry B | $77,500 | -- | |
| Meade Richard K | $74,500 | -- |
Source: Public Records
Tax History Compared to Growth
Tax History
| Year | Tax Paid | Tax Assessment Tax Assessment Total Assessment is a certain percentage of the fair market value that is determined by local assessors to be the total taxable value of land and additions on the property. | Land | Improvement |
|---|---|---|---|---|
| 2024 | $2,702 | $69,522 | $17,868 | $51,654 |
| 2023 | $2,462 | $65,756 | $16,243 | $49,513 |
| 2022 | $1,987 | $54,457 | $13,401 | $41,056 |
| 2021 | $1,746 | $47,047 | $13,401 | $33,646 |
| 2020 | $1,566 | $41,856 | $10,152 | $31,704 |
| 2019 | $1,477 | $39,914 | $10,152 | $29,762 |
| 2018 | $1,406 | $37,972 | $10,152 | $27,820 |
| 2017 | $1,439 | $38,862 | $10,152 | $28,710 |
| 2016 | $1,430 | $38,512 | $10,120 | $28,392 |
| 2015 | $1,383 | $39,438 | $10,120 | $29,318 |
| 2014 | $1,383 | $39,438 | $10,120 | $29,318 |
Source: Public Records
Map
Nearby Homes
- 9 Ladonna Place SW
- 30 Westover Dr SW
- 0 Westlyn Dr Unit 10599621
- 0 Westlyn Dr Unit 7645405
- 15 Ladonna Place SW
- 3 Lovell Ln SW
- 108 Deerbrook Dr SW
- 1 Westlyn Dr SW
- 25 Ridge Dr SW
- 216 Coosawattee Ave SW
- 3 Oak Ridge Ct NE
- 106 Kenwood Dr SW
- 200 Coosawattee Ave SW
- 52 Glenda Dr SW
- 10 Thornwood Dr SW
- 15 John Ross Dr SW
- 203 Hycliff Rd SW
- 43 Westwood Cir SW
- 106 Melody Ln NW
- 2604 Shorter Ave NW
- 16 Wilson Dr SW
- 20 Wilson Dr SW
- 5 Christopher Place SW
- 21 Wilson Dr SW
- 23 Wilson Dr SW
- 14 Wilson Dr SW
- 205 Coker Dr SW
- 4 Christopher Place SW
- 19 Wilson Dr SW
- 301 Coker Dr SW
- 301 Coker Dr SW Unit Sec 3
- 17 Wilson Dr SW
- 12 Wilson Dr SW
- 2 Gregory Dr SW
- 222 Billy Pyle Rd SW
- 3 Christopher Place SW
- 203 Coker Dr SW
- 8 Wilson Dr SW
- 8 Wilson Dr SW Unit 28
- 2 Christopher Place SW