Estimated Value: $1,126,699 - $1,299,000
4
Beds
3
Baths
3,012
Sq Ft
$396/Sq Ft
Est. Value
About This Home
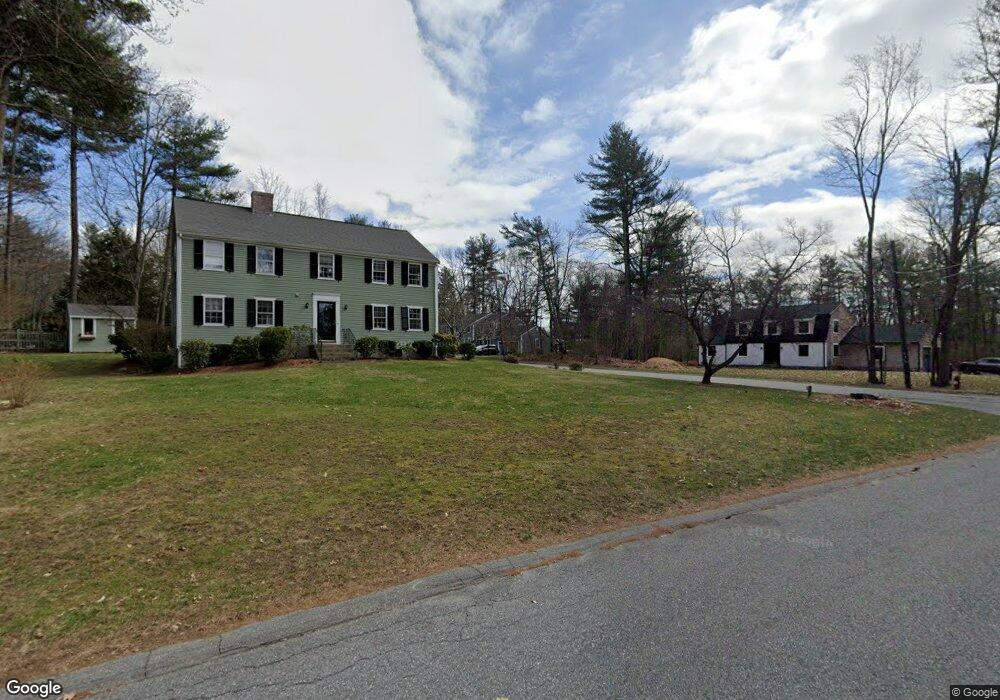
This home is located at 18 Wilson Ln, Acton, MA 01720 and is currently estimated at $1,193,425, approximately $396 per square foot. 18 Wilson Ln is a home located in Middlesex County with nearby schools including Acton-Boxborough Regional High School.
Ownership History
Date
Name
Owned For
Owner Type
Purchase Details
Closed on
Sep 30, 2008
Sold by
Neergaard Judy A and Neergaard Stephen E
Bought by
Nigro Alycen P and Nigro Stephen A
Current Estimated Value
Home Financials for this Owner
Home Financials are based on the most recent Mortgage that was taken out on this home.
Original Mortgage
$493,000
Outstanding Balance
$330,029
Interest Rate
6.57%
Mortgage Type
Purchase Money Mortgage
Estimated Equity
$863,396
Purchase Details
Closed on
Feb 20, 1990
Sold by
Fultz Jack F
Bought by
Neergaard Judy A
Create a Home Valuation Report for This Property
The Home Valuation Report is an in-depth analysis detailing your home's value as well as a comparison with similar homes in the area
Home Values in the Area
Average Home Value in this Area
Purchase History
| Date | Buyer | Sale Price | Title Company |
|---|---|---|---|
| Nigro Alycen P | $690,800 | -- | |
| Neergaard Judy A | $304,000 | -- |
Source: Public Records
Mortgage History
| Date | Status | Borrower | Loan Amount |
|---|---|---|---|
| Open | Nigro Alycen P | $493,000 | |
| Previous Owner | Neergaard Judy A | $408,000 | |
| Previous Owner | Neergaard Judy A | $57,000 | |
| Previous Owner | Neergaard Judy A | $303,750 |
Source: Public Records
Tax History
| Year | Tax Paid | Tax Assessment Tax Assessment Total Assessment is a certain percentage of the fair market value that is determined by local assessors to be the total taxable value of land and additions on the property. | Land | Improvement |
|---|---|---|---|---|
| 2025 | $16,155 | $942,000 | $369,600 | $572,400 |
| 2024 | $15,100 | $905,800 | $369,600 | $536,200 |
| 2023 | $14,980 | $853,100 | $335,900 | $517,200 |
| 2022 | $14,162 | $728,100 | $291,800 | $436,300 |
| 2021 | $13,827 | $683,500 | $270,300 | $413,200 |
| 2020 | $13,041 | $677,800 | $270,300 | $407,500 |
| 2019 | $12,538 | $647,300 | $270,300 | $377,000 |
| 2018 | $12,512 | $645,600 | $270,300 | $375,300 |
| 2017 | $12,189 | $639,500 | $270,300 | $369,200 |
| 2016 | $11,946 | $621,200 | $270,300 | $350,900 |
| 2015 | $11,718 | $615,100 | $270,300 | $344,800 |
| 2014 | $11,310 | $581,500 | $270,300 | $311,200 |
Source: Public Records
Map
Nearby Homes
- 79 Charter Rd
- 18 Hayward Rd
- 96 Newtown Rd
- 11 Braebrook
- 5 Perkins Ln
- 20 Joseph Reed Ln
- 33 Meadowbrook Rd
- 46 Taylor Rd
- 491 Main St
- 103 Nagog Hill Rd
- 7 Kelley Rd
- 27 Forest Rd
- 524 Main St
- 6 Old Village Rd
- 709 Main St
- 235 Arlington St
- 4 Littlefield Rd
- 184 Main St Unit 3
- 631 Massachusetts Ave Unit 631
- 95 Concord Rd
Your Personal Tour Guide
Ask me questions while you tour the home.