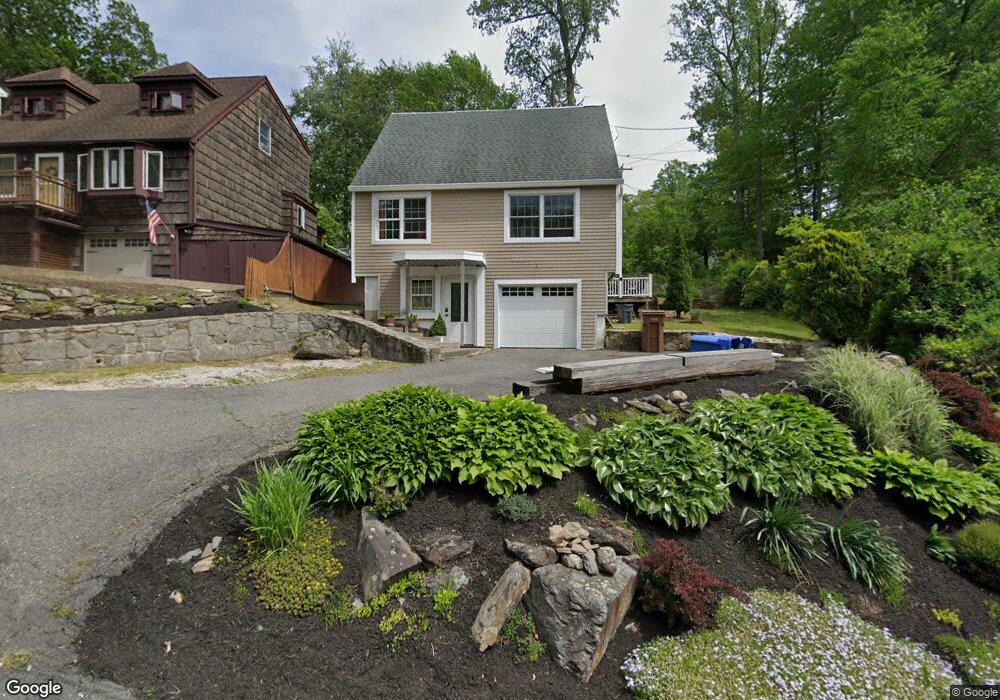
18 Wopowog Trail Shelton, CT 06484
Estimated Value: $302,000 - $455,000
3
Beds
2
Baths
1,261
Sq Ft
$313/Sq Ft
Est. Value
About This Home
This home is located at 18 Wopowog Trail, Shelton, CT 06484 and is currently estimated at $394,216, approximately $312 per square foot. 18 Wopowog Trail is a home located in Fairfield County with nearby schools including Perry Hill School, Shelton Intermediate School, and Shelton High School.
Ownership History
Date
Name
Owned For
Owner Type
Purchase Details
Closed on
Jan 30, 2017
Sold by
Niedzwiecki Piotr and Niedzwiecka Barbara
Bought by
Niedzwiecki Paul
Current Estimated Value
Home Financials for this Owner
Home Financials are based on the most recent Mortgage that was taken out on this home.
Original Mortgage
$143,846
Outstanding Balance
$119,661
Interest Rate
4.37%
Mortgage Type
FHA
Estimated Equity
$274,555
Purchase Details
Closed on
Jan 5, 2011
Sold by
Fnma
Bought by
Niedzwiecki Piotr
Purchase Details
Closed on
Dec 28, 2009
Sold by
Suntrust Mortgage Inc
Bought by
Federal National Mortgage Association
Purchase Details
Closed on
Aug 2, 2005
Sold by
Zapadka Robert
Bought by
Wash Karren
Purchase Details
Closed on
Mar 4, 2002
Sold by
Department Of Housing & Urban Dev
Bought by
Zapadka Robert
Purchase Details
Closed on
Dec 1, 1994
Sold by
Sachs Robert and Sachs Laurie
Bought by
Kealey Robert and Kealey Shirley
Create a Home Valuation Report for This Property
The Home Valuation Report is an in-depth analysis detailing your home's value as well as a comparison with similar homes in the area
Home Values in the Area
Average Home Value in this Area
Purchase History
| Date | Buyer | Sale Price | Title Company |
|---|---|---|---|
| Niedzwiecki Paul | $146,500 | -- | |
| Niedzwiecki Paul | $146,500 | -- | |
| Niedzwiecki Piotr | $150,000 | -- | |
| Niedzwiecki Piotr | $150,000 | -- | |
| Federal National Mortgage Association | -- | -- | |
| Suntrust Mortgage Inc | -- | -- | |
| Suntrust Mortgage Inc | -- | -- | |
| Wash Karren | $280,000 | -- | |
| Wash Karren | $280,000 | -- | |
| Zapadka Robert | $121,000 | -- | |
| Zapadka Robert | $121,000 | -- | |
| Kealey Robert | $124,000 | -- | |
| Kealey Robert | $124,000 | -- |
Source: Public Records
Mortgage History
| Date | Status | Borrower | Loan Amount |
|---|---|---|---|
| Open | Kealey Robert | $143,846 |
Source: Public Records
Tax History Compared to Growth
Tax History
| Year | Tax Paid | Tax Assessment Tax Assessment Total Assessment is a certain percentage of the fair market value that is determined by local assessors to be the total taxable value of land and additions on the property. | Land | Improvement |
|---|---|---|---|---|
| 2025 | $3,280 | $174,300 | $55,160 | $119,140 |
| 2024 | $3,343 | $174,300 | $55,160 | $119,140 |
| 2023 | $3,045 | $174,300 | $55,160 | $119,140 |
| 2022 | $3,045 | $174,300 | $55,160 | $119,140 |
| 2021 | $3,212 | $145,810 | $51,660 | $94,150 |
| 2020 | $3,269 | $145,810 | $51,660 | $94,150 |
| 2019 | $3,269 | $145,810 | $51,660 | $94,150 |
| 2017 | $3,238 | $145,810 | $51,660 | $94,150 |
| 2015 | $3,039 | $136,220 | $33,250 | $102,970 |
| 2014 | $3,039 | $136,220 | $33,250 | $102,970 |
Source: Public Records
Map
Nearby Homes
- 15 Orowoc Trail
- 3 Noguchi Trail
- 8 Piegan Trail
- 6 Pochong Trail
- 35 Saginaw Trail
- 38 Ojibwa Rd
- 115 Kyles Way
- 11 Pueblo Trail
- 60 Engine House Rd Unit D
- 3 Murphys Ln Unit 12
- 54 Wedgewood Rd Unit D
- 8 Algonkin Rd Unit B
- 8 Algonkin Rd Unit A
- 11 Warner Hill Rd
- 20 Brinsmayd Ave
- 6 Daybreak Ln
- 511 Asbury Ridge
- 665 River Rd Unit 2
- 519 Asbury Ridge
- 125 Warner Hill Rd Unit 3
- 11 Wopowog Trail
- 11 Wopowog Trail Unit B
- 11 Wopowog Trail Unit A
- 15 Wopowog Trail
- 14 Wopowog Trail
- 13 Wopowog Trail
- 16 Wopowog Trail
- 24 Wopowog Trail
- 1 Noguchi Trail
- 20 Wopowog Trail
- 4 Orowoc Trail
- 14 Orowoc Trail
- 7 Wopowog Trail
- 117 Winibig Trail
- 116 Winibig Trail
- 8 Noguchi Trail
- 21 Wopowog Trail
- 21 Wopowog Trail Unit 1
- 115 Winibig Trail
- 114 Winibig Trail