180 Baggett Ln Dickson, TN 37055
Estimated Value: $256,617 - $296,000
About This Home
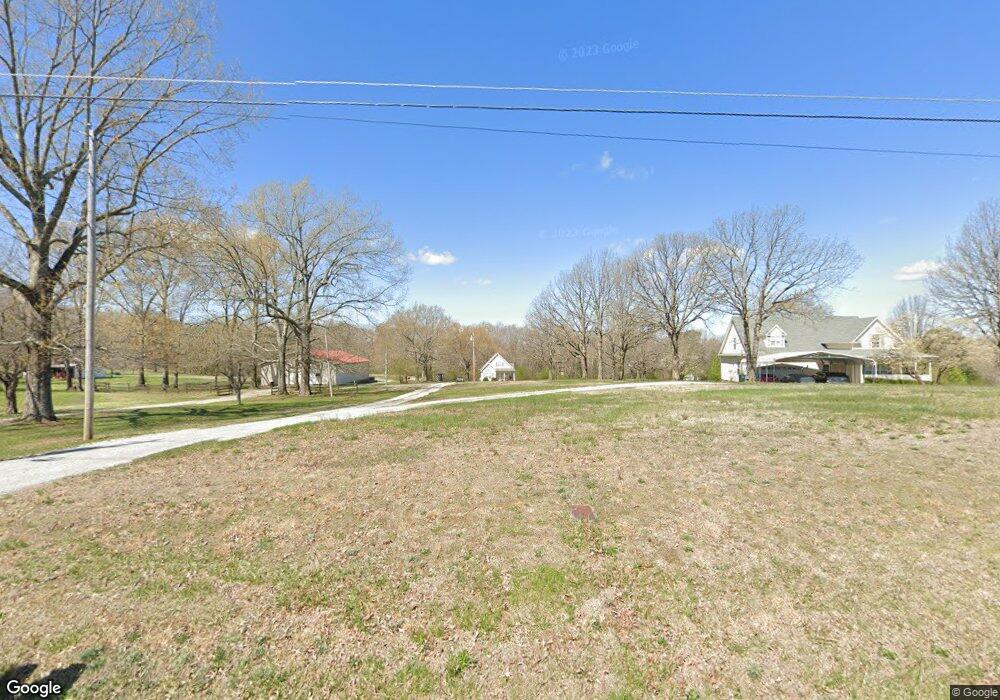
This home is located at 180 Baggett Ln, Dickson, TN 37055 and is currently estimated at $278,154, approximately $278 per square foot. 180 Baggett Ln is a home located in Dickson County with nearby schools including Dickson Elementary School, Dickson Middle School, and Dickson County High School.
Ownership History
We collect this data history from publicly available records. To have your information removed, we recommend requesting removal directly through your county’s website.
Purchase Details
Home Financials for this Owner
Home Financials are based on the most recent Mortgage that was taken out on this home.Purchase Details
Home Financials for this Owner
Home Financials are based on the most recent Mortgage that was taken out on this home.Purchase Details
Purchase Details
Purchase Details
Purchase Details
Home Values in the Area
Average Home Value in this Area
Purchase History
We collect this data history from publicly available records. To have your information removed, we recommend requesting removal directly through your county’s website.
| Date | Buyer | Sale Price | Title Company |
|---|---|---|---|
| $127,500 | -- | ||
| $110,000 | -- | ||
| $125,000 | -- | ||
| -- | -- | ||
| $15,000 | -- | ||
| $35,000 | -- |
Mortgage History
We collect this data history from publicly available records. To have your information removed, we recommend requesting removal directly through your county’s website.
| Date | Status | Borrower | Loan Amount |
|---|---|---|---|
| Open | $102,040 | ||
| Previous Owner | $113,984 |
Tax History
We collect this data history from publicly available records. To have your information removed, we recommend requesting removal directly through your county’s website.
| Year | Tax Paid | Tax Assessment Tax Assessment Total Assessment is a certain percentage of the fair market value that is determined by local assessors to be the total taxable value of land and additions on the property. | Land | Improvement |
|---|---|---|---|---|
| 2025 | -- | $45,250 | $6,725 | $38,525 |
| 2024 | -- | $45,250 | $6,725 | $38,525 |
| 2023 | $1,038 | $33,225 | $5,200 | $28,025 |
| 2022 | $1,038 | $33,225 | $5,200 | $28,025 |
| 2021 | $1,038 | $33,225 | $5,200 | $28,025 |
| 2020 | $1,038 | $33,225 | $5,200 | $28,025 |
| 2019 | $1,038 | $33,225 | $5,200 | $28,025 |
| 2018 | $1,037 | $28,400 | $4,875 | $23,525 |
| 2017 | $1,037 | $28,400 | $4,875 | $23,525 |
| 2016 | $1,037 | $28,400 | $4,875 | $23,525 |
| 2015 | $949 | $24,475 | $4,875 | $19,600 |
| 2014 | $949 | $24,475 | $4,875 | $19,600 |
Map
- 115 Sherron Dr
- 0 Furnace Hollow Rd
- 0 Furnace Hollow Rd Unit 5
- 712 Highway 48 S
- 0 W Walnut St
- 122 Payne Springs Rd
- 1015 Pin Oak Dr
- 0 Eno Rd Unit RTC3184833
- 110 Acorn Dr
- 701 W 5th St
- 430 Center Ave
- 116 Eno Rd
- 1007 Edgewood Dr
- 0 W First St Unit 22
- 0 Hardin Ave
- 210 Hardin Ave
- 0 White Oak Dr
- 0 White Oak Dr Unit 3
- 412 High St
- 146 Eno Rd
- 170 Baggett Ln
- 200 Baggett Ln
- 210 Baggett Ln
- 1104 Highway 47 E
- 140 Baggett Ln
- 167 Baggett Ln
- 171 Baggett Ln
- 183 Baggett Ln
- 195 Baggett Ln
- 149 Baggett Ln
- 201 Baggett Ln
- 111 Regency Ln
- 145 Baggett Ln
- 209 Baggett Ln
- 134 Sherron Dr
- 143 Baggett Ln
- 117 Regency Ln
- 213 Baggett Ln
- 107 Regency Ln
- 130 Sherron Dr
Ask me questions while you tour the home.