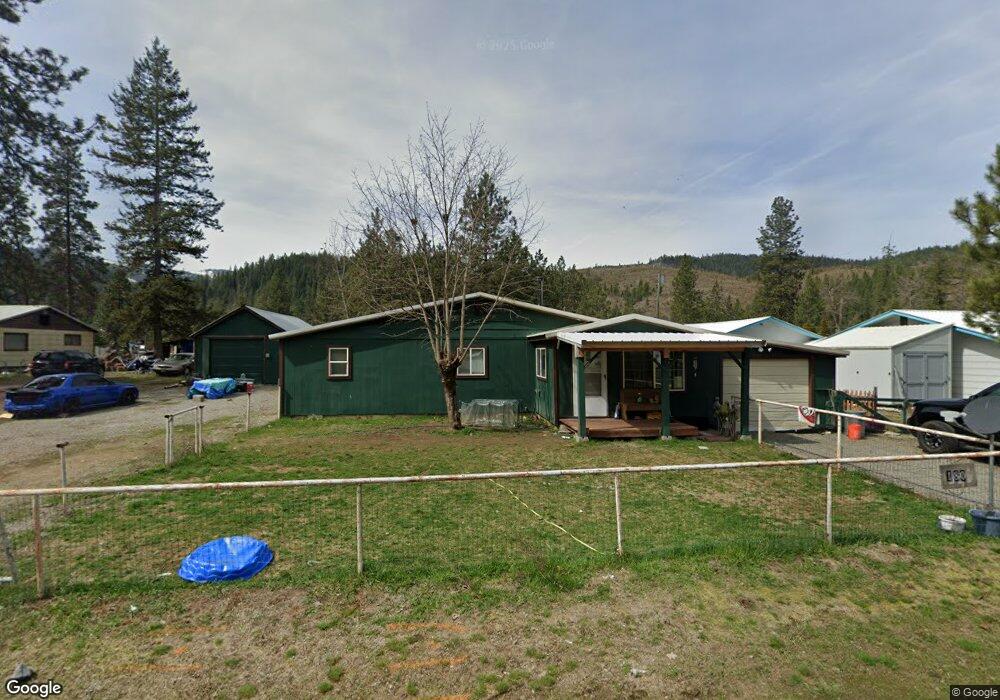
180 Barker Loop Pinehurst, ID 83850
Estimated Value: $252,743 - $287,000
3
Beds
1
Bath
1,001
Sq Ft
$264/Sq Ft
Est. Value
About This Home
This home is located at 180 Barker Loop, Pinehurst, ID 83850 and is currently estimated at $264,186, approximately $263 per square foot. 180 Barker Loop is a home located in Shoshone County with nearby schools including Pinehurst Elementary School, Kellogg Middle School, and Kellogg High School.
Ownership History
Date
Name
Owned For
Owner Type
Purchase Details
Closed on
Mar 18, 2025
Sold by
Rel Nora Nicole and Kitchen Jarred John
Bought by
Wolf Billy Ray and Wolf Alexa R
Current Estimated Value
Home Financials for this Owner
Home Financials are based on the most recent Mortgage that was taken out on this home.
Original Mortgage
$8,607
Outstanding Balance
$5,253
Interest Rate
6.89%
Mortgage Type
FHA
Estimated Equity
$258,933
Purchase Details
Closed on
Oct 3, 2022
Sold by
Hubbard Robert S and Hubbard Teresa K
Bought by
Kitchen Jarred John and Rel Nora Nicole
Home Financials for this Owner
Home Financials are based on the most recent Mortgage that was taken out on this home.
Original Mortgage
$210,378
Interest Rate
6.7%
Mortgage Type
New Conventional
Purchase Details
Closed on
May 19, 2016
Sold by
Hayslip L Loraine and Hayslip Lillian L
Bought by
Hubbard Robert S and Hubbard Teresa K
Create a Home Valuation Report for This Property
The Home Valuation Report is an in-depth analysis detailing your home's value as well as a comparison with similar homes in the area
Purchase History
| Date | Buyer | Sale Price | Title Company |
|---|---|---|---|
| Wolf Billy Ray | -- | Flying S Title And Escrow | |
| Kitchen Jarred John | -- | Flying S Title | |
| Hubbard Robert S | -- | First American Title Co |
Source: Public Records
Mortgage History
| Date | Status | Borrower | Loan Amount |
|---|---|---|---|
| Open | Wolf Billy Ray | $8,607 | |
| Open | Wolf Billy Ray | $281,703 | |
| Previous Owner | Kitchen Jarred John | $210,378 |
Source: Public Records
Tax History
| Year | Tax Paid | Tax Assessment Tax Assessment Total Assessment is a certain percentage of the fair market value that is determined by local assessors to be the total taxable value of land and additions on the property. | Land | Improvement |
|---|---|---|---|---|
| 2025 | $551 | $174,622 | $63,512 | $111,110 |
| 2024 | $610 | $174,622 | $63,512 | $111,110 |
| 2023 | $610 | $165,031 | $63,512 | $101,519 |
| 2022 | $631 | $130,985 | $28,838 | $102,147 |
| 2021 | $687 | $100,427 | $21,183 | $79,244 |
| 2020 | $587 | $82,705 | $20,166 | $62,539 |
| 2019 | $615 | $80,882 | $18,133 | $62,749 |
| 2018 | $135 | $51,123 | $13,133 | $37,990 |
| 2017 | $501 | $63,034 | $13,133 | $49,901 |
| 2016 | $40 | $62,413 | $13,133 | $49,280 |
| 2015 | -- | $71,293 | $13,133 | $58,160 |
| 2014 | -- | $71,293 | $13,133 | $58,160 |
Source: Public Records
Map
Nearby Homes
- 625 E Fork French Gulch Rd
- 30.91acs French Gulch Rd
- 1 Elsie Peak Ct Unit B1, BLDG B
- 106 Blazing Saddle
- 6 Maple Ave
- 301 Woodland Dr
- 207 S Division St
- 305 S 1st
- 1231 French Gulch Rd
- 113 Trail Blazer Ct
- 754 Paradise Ln
- 111 Trail Blazer Ct
- 202 Silver Saddle Ct
- 208 S 6th St
- 924 Lower Page Rd
- 120 Blazing Saddle
- 107 Blazing Saddle Ct
- 207 Palamino Ct
- 827 & 835 Lower Page Rd
- 203 Palomino
- 516 W Fork Pine Creek Rd
- 502 W Fork Pine Creek Rd
- 542 W Fork Pine Creek Rd
- 472 W Fork Pine Creek Rd
- 2 Brady Ln
- 438 W Fork Pine Creek Rd
- 542 W Pinecreek Rd
- 368 W Fork Pine Creek Rd
- 83 Village Loop
- 88 Barker Loop
- 43 Barker Loop
- 320 Trusty
- 43 Barker Loop - Pinecr
- 0 Village Loop
- 952 West Fork Pine Creek Rd
- 338 W Fork Pine Creek Rd
- 131 Village Loop
- 150 Village Loop
- 15 Maple Ln
- NKA Village Loop Rd
Your Personal Tour Guide
Ask me questions while you tour the home.