180 Branch Rd Roxbury, NH 03431
Estimated Value: $325,000 - $381,000
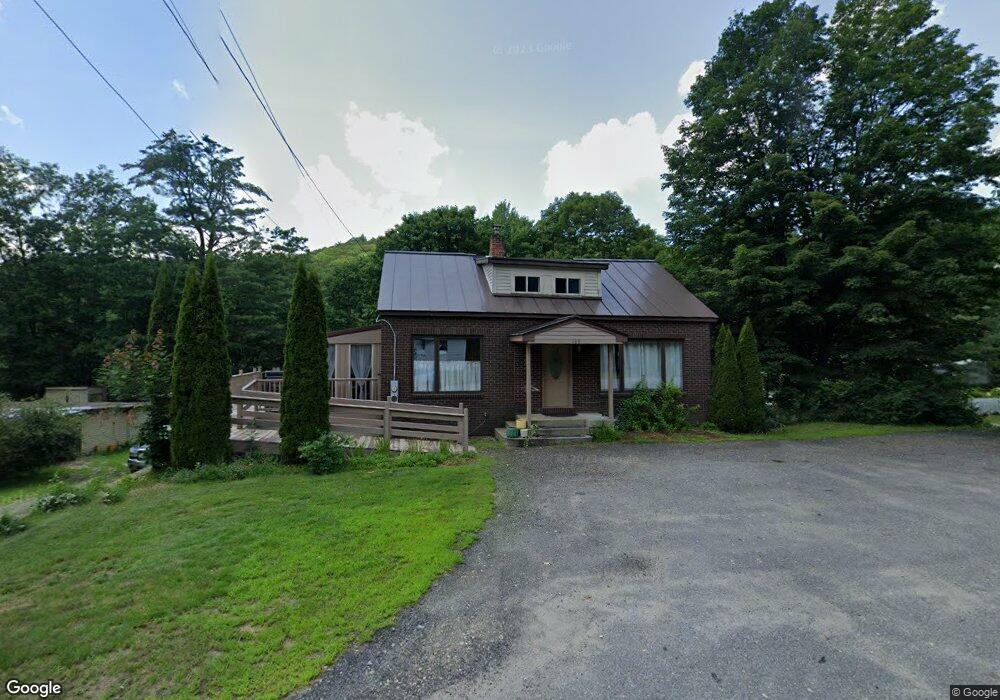
About This Home
This home is located at 180 Branch Rd, Roxbury, NH 03431 and is currently estimated at $352,465, approximately $173 per square foot. 180 Branch Rd is a home located in Cheshire County with nearby schools including Mt. Caesar Elementary School, Cutler School, and Keene High School.
Ownership History
We collect this data history from publicly available records. To have your information removed, we recommend requesting removal directly through your county’s website.
Purchase Details
Purchase Details
Home Financials for this Owner
Home Financials are based on the most recent Mortgage that was taken out on this home.Purchase Details
Purchase History
We collect this data history from publicly available records. To have your information removed, we recommend requesting removal directly through your county’s website.
| Date | Buyer | Sale Price | Title Company |
|---|---|---|---|
| -- | None Available | ||
| -- | None Available | ||
| $165,000 | -- | ||
| $165,000 | -- | ||
| $80,000 | -- | ||
| $80,000 | -- |
Mortgage History
We collect this data history from publicly available records. To have your information removed, we recommend requesting removal directly through your county’s website.
| Date | Status | Borrower | Loan Amount |
|---|---|---|---|
| Previous Owner | $160,050 | ||
| Closed | $0 |
Tax History
We collect this data history from publicly available records. To have your information removed, we recommend requesting removal directly through your county’s website.
| Year | Tax Paid | Tax Assessment Tax Assessment Total Assessment is a certain percentage of the fair market value that is determined by local assessors to be the total taxable value of land and additions on the property. | Land | Improvement |
|---|---|---|---|---|
| 2025 | $5,491 | $328,600 | $51,000 | $277,600 |
| 2024 | $5,139 | $328,600 | $51,000 | $277,600 |
| 2023 | $4,932 | $179,200 | $27,400 | $151,800 |
| 2022 | $4,324 | $179,200 | $27,400 | $151,800 |
| 2020 | $4,546 | $179,200 | $27,400 | $151,800 |
| 2019 | $4,386 | $173,500 | $27,400 | $146,100 |
| 2018 | $3,633 | $145,300 | $25,100 | $120,200 |
| 2017 | $3,656 | $145,300 | $25,100 | $120,200 |
| 2016 | $3,555 | $140,400 | $25,100 | $115,300 |
| 2015 | $3,436 | $140,400 | $25,100 | $115,300 |
| 2013 | $3,365 | $154,000 | $34,400 | $119,600 |
Map
- 00 Chapman Rd Unit 41-1
- 21 Pheasant Hill Rd
- 130 Eastern Ave
- 21 Lorraine St
- 974 Marlboro Rd
- 21 Hancock St
- 0 Optical Ave Unit 3,4,5
- 337 Roxbury St
- 12 S Lincoln St
- 72 N Lincoln St
- 35 Foster St
- 61 Kelleher St
- 131 Marlboro St
- 14-16 Grove St
- 59 South St
- 90 Monadnock Hwy
- 77 Monadnock Hwy
- 37 Dover St
- 126 Monadnock Hwy
- 47 Baker St
Ask me questions while you tour the home.