M
Landlord's Agent in 2013
Michael Maloon
Divito Realty

Estimated Value: $358,547 - $380,000
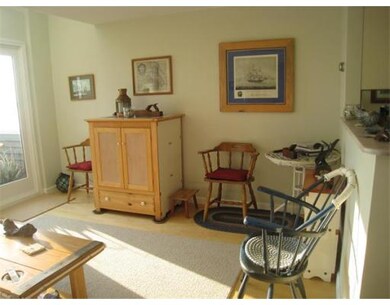
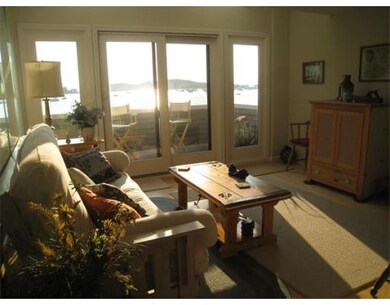
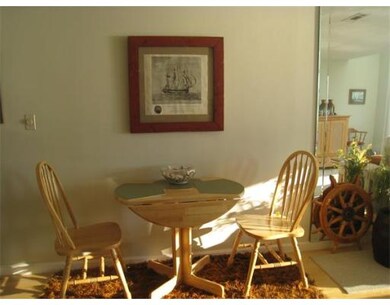
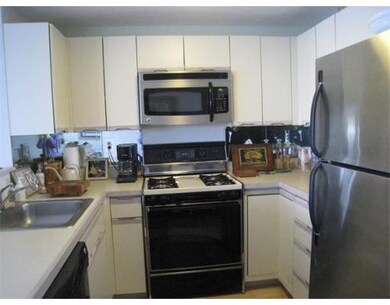
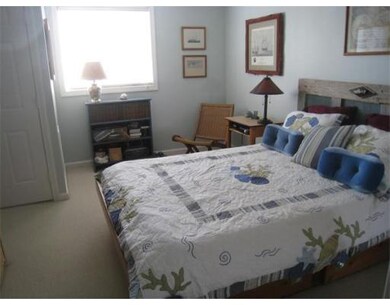
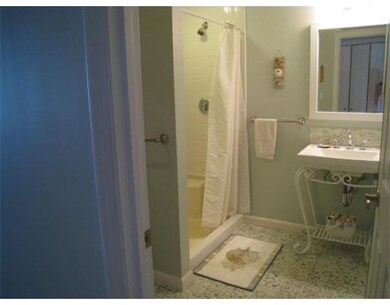
Available May 1st for year-round rental. Beautiful 1 bedroom, 1 bath unit with stunning views of Boston skyline and gorgeous sunsets from a private deck. Unit is clean and bright with lots of closets and storage with full-sized laundry room. Central a/c. Assigned, off-street parking. A waterfront dream come true!
Last Agent to Rent the Property
Michael Maloon
Divito Realty Listed on: 03/21/2013
Last Renter's Agent
Michael Maloon
Divito Realty Listed on: 03/21/2013
Home Type
Other
Year Built
1989
Lot Details
0 Sq Ft Lot
| Date | Event | Price | List to Sale | Price per Sq Ft |
|---|---|---|---|---|
| 05/01/2013 05/01/13 | Rented | $1,200 | 0.0% | -- |
| 04/01/2013 04/01/13 | Under Contract | -- | -- | -- |
| 03/21/2013 03/21/13 | For Rent | $1,200 | -- | -- |
| Year | Tax Paid | Tax Assessment Tax Assessment Total Assessment is a certain percentage of the fair market value that is determined by local assessors to be the total taxable value of land and additions on the property. | Land | Improvement |
|---|---|---|---|---|
| 2025 | $3,696 | $330,000 | $0 | $330,000 |
| 2024 | $3,636 | $312,100 | $0 | $312,100 |
| 2023 | $3,584 | $294,500 | $0 | $294,500 |
| 2022 | $3,060 | $244,000 | $0 | $244,000 |
| 2021 | $2,726 | $215,000 | $0 | $215,000 |
| 2020 | $2,446 | $190,800 | $0 | $190,800 |
| 2019 | $2,490 | $190,800 | $0 | $190,800 |
| 2018 | $2,561 | $190,800 | $0 | $190,800 |
| 2017 | $2,618 | $190,800 | $0 | $190,800 |
| 2016 | $2,572 | $190,800 | $0 | $190,800 |
| 2015 | $2,709 | $194,300 | $0 | $194,300 |
| 2014 | $2,695 | $194,300 | $0 | $194,300 |
M
Landlord's Agent in 2013
Michael Maloon
Divito Realty
Source: MLS Property Information Network (MLS PIN)
MLS Number: 71497041
APN: HULL-000012-000000-000104-I000000
Disclaimer: Certain information contained herein is derived from information provided by parties other than Homes.com. All information provided is deemed reliable, but is not guaranteed to be accurate and should be independently verified.
![]() The property listing data and information, or the Images, set forth herein were provided to MLS Property Information Network, Inc. from third party sources, including sellers, lessors and public records, and were compiled by MLS Property Information Network, Inc. The property listing data and information, and the Images, are for the personal, non-commercial use of consumers having a good faith interest in purchasing or leasing listed properties of the type displayed to them and may not be used for any purpose other than to identify prospective properties which such consumers may have a good faith interest in purchasing or leasing. MLS Property Information Network, Inc. and its subscribers disclaim any and all representations and warranties as to the accuracy of the property listing data and information, or as to the accuracy of any of the Images, set forth herein.
The property listing data and information, or the Images, set forth herein were provided to MLS Property Information Network, Inc. from third party sources, including sellers, lessors and public records, and were compiled by MLS Property Information Network, Inc. The property listing data and information, and the Images, are for the personal, non-commercial use of consumers having a good faith interest in purchasing or leasing listed properties of the type displayed to them and may not be used for any purpose other than to identify prospective properties which such consumers may have a good faith interest in purchasing or leasing. MLS Property Information Network, Inc. and its subscribers disclaim any and all representations and warranties as to the accuracy of the property listing data and information, or as to the accuracy of any of the Images, set forth herein.
Ask me questions while you tour the home.
