180 Dock Tallent Rd Franklin, NC 28734
Estimated Value: $312,745 - $393,000
3
Beds
2
Baths
1,568
Sq Ft
$226/Sq Ft
Est. Value
About This Home
This home is located at 180 Dock Tallent Rd, Franklin, NC 28734 and is currently estimated at $354,436, approximately $226 per square foot. 180 Dock Tallent Rd is a home located in Macon County with nearby schools including Iotla Valley Elementary School, Mountain View Intermediate School, and Macon Middle School.
Ownership History
Date
Name
Owned For
Owner Type
Purchase Details
Closed on
Oct 8, 2021
Sold by
Seymour Chad Christopher
Bought by
Seymour Jessica Stanley and Stanley Jessica Elyse
Current Estimated Value
Purchase Details
Closed on
Jul 22, 2010
Sold by
Whitworth Joel T
Bought by
Whitworth Amanda E
Home Financials for this Owner
Home Financials are based on the most recent Mortgage that was taken out on this home.
Original Mortgage
$156,000
Outstanding Balance
$103,560
Interest Rate
4.7%
Mortgage Type
New Conventional
Estimated Equity
$250,876
Purchase Details
Closed on
Jun 23, 2006
Sold by
Elders Amanda and Whitworth Amada Elders
Bought by
Whitworth Amanda Elders and Whitworth Joel
Home Financials for this Owner
Home Financials are based on the most recent Mortgage that was taken out on this home.
Original Mortgage
$125,700
Interest Rate
6.55%
Mortgage Type
New Conventional
Create a Home Valuation Report for This Property
The Home Valuation Report is an in-depth analysis detailing your home's value as well as a comparison with similar homes in the area
Home Values in the Area
Average Home Value in this Area
Purchase History
| Date | Buyer | Sale Price | Title Company |
|---|---|---|---|
| Seymour Jessica Stanley | -- | None Available | |
| Whitworth Amanda E | -- | -- | |
| Whitworth Amanda Elders | -- | None Available |
Source: Public Records
Mortgage History
| Date | Status | Borrower | Loan Amount |
|---|---|---|---|
| Open | Whitworth Amanda E | $156,000 | |
| Closed | Whitworth Amanda Elders | $125,700 |
Source: Public Records
Tax History Compared to Growth
Tax History
| Year | Tax Paid | Tax Assessment Tax Assessment Total Assessment is a certain percentage of the fair market value that is determined by local assessors to be the total taxable value of land and additions on the property. | Land | Improvement |
|---|---|---|---|---|
| 2025 | $1,012 | $261,510 | $36,260 | $225,250 |
| 2024 | $1,012 | $261,510 | $36,260 | $225,250 |
| 2023 | $867 | $261,610 | $36,260 | $225,350 |
| 2022 | $867 | $160,300 | $21,000 | $139,300 |
| 2021 | $842 | $161,500 | $21,000 | $140,500 |
| 2020 | $799 | $160,900 | $20,400 | $140,500 |
| 2018 | $720 | $154,790 | $21,000 | $133,790 |
| 2017 | $720 | $154,790 | $21,000 | $133,790 |
| 2016 | $704 | $154,790 | $21,000 | $133,790 |
| 2015 | $681 | $154,790 | $21,000 | $133,790 |
| 2014 | $614 | $175,480 | $21,250 | $154,230 |
| 2013 | -- | $175,480 | $21,250 | $154,230 |
Source: Public Records
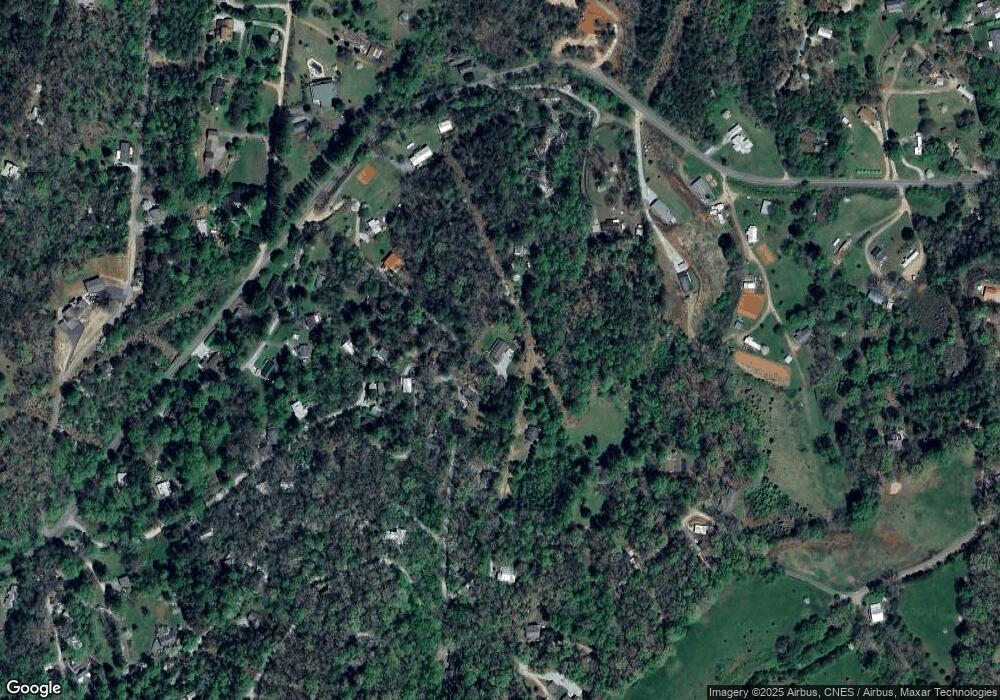
Map
Nearby Homes
- 30 Maxies Corner Rd
- 00 Pine Ridge Dr
- 30 Little Village Way
- 109 Jewel Ln
- 113 Courtney Marie Dr
- 133 Underburg Ln
- Lot 26 Bryson City Rd
- Lot 19 Bryson City Rd
- 423 Pannell Ln
- 169 Cszonka Rd
- 567 Clyde Downs Rd
- 59 Clear Sky Dr
- 225 Iotla Church Rd
- 1817 Lakeside Dr
- Lot 5 Quail Hollow
- 211 Greenbrier St
- 00 Town Mountain Dr
- Lot S-16 Town Mountain Dr
- 75 Red Fox Ln
- 427 Town Mountain Dr
- 555 Zurich Cir
- 25 Maxies Corner Rd
- 129 China Springs Rd
- 45 Maxies Corner Rd
- 287 China Springs Rd
- 16 Maxies Corner Rd
- 177 China Springs Rd
- 530 Zurich Cir
- 85 Wolf Run Rd
- 367 Zurich Cir
- 43 Wolf Run Rd
- 84 Dock Tallent Rd
- 515 Zurich Cir
- 95 Wolf Run Rd
- 39 Wolf Run Rd
- 66 Wolf Run Rd
- 31 China Springs Rd
- 166 Thunder Trail
- 56 Dock Tallent Rd
- 699 Zurich Cir