180 E Allen St Leslie, GA 31764
Estimated Value: $151,000 - $302,000
3
Beds
2
Baths
2,565
Sq Ft
$88/Sq Ft
Est. Value
About This Home
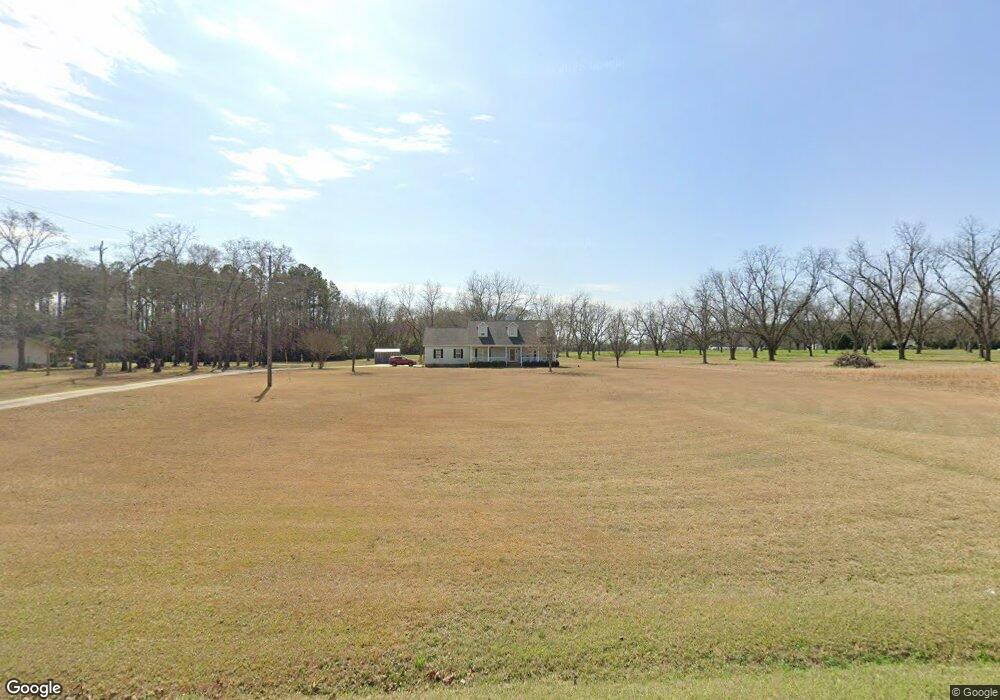
This home is located at 180 E Allen St, Leslie, GA 31764 and is currently estimated at $226,912, approximately $88 per square foot. 180 E Allen St is a home located in Sumter County with nearby schools including Sumter County Primary School, Sumter County Elementary School, and Sumter County Middle School.
Ownership History
Date
Name
Owned For
Owner Type
Purchase Details
Closed on
Jul 31, 2014
Sold by
Clemens Nancy Rooks
Bought by
Summerford Jaems B and Summerford Orita H
Current Estimated Value
Home Financials for this Owner
Home Financials are based on the most recent Mortgage that was taken out on this home.
Original Mortgage
$130,000
Outstanding Balance
$99,310
Interest Rate
4.16%
Mortgage Type
VA
Estimated Equity
$127,602
Purchase Details
Closed on
Aug 4, 2011
Sold by
Secretary Of Housing & Urban Development
Bought by
Rooks Nancy
Home Financials for this Owner
Home Financials are based on the most recent Mortgage that was taken out on this home.
Original Mortgage
$102,338
Interest Rate
4.5%
Mortgage Type
FHA
Purchase Details
Closed on
May 9, 2011
Sold by
Thomas Anthony Dwayne
Bought by
Everhome Mortgage Company
Purchase Details
Closed on
Apr 29, 2011
Sold by
Everhome Mortgage Company
Bought by
The Secretary Of Housing & Urban Develop
Purchase Details
Closed on
Mar 6, 2003
Bought by
Barrow Thomas Lawson
Create a Home Valuation Report for This Property
The Home Valuation Report is an in-depth analysis detailing your home's value as well as a comparison with similar homes in the area
Home Values in the Area
Average Home Value in this Area
Purchase History
| Date | Buyer | Sale Price | Title Company |
|---|---|---|---|
| Summerford Jaems B | $130,000 | -- | |
| Rooks Nancy | $105,000 | -- | |
| Everhome Mortgage Company | $176,234 | -- | |
| The Secretary Of Housing & Urban Develop | -- | -- | |
| Barrow Thomas Lawson | -- | -- |
Source: Public Records
Mortgage History
| Date | Status | Borrower | Loan Amount |
|---|---|---|---|
| Open | Summerford Jaems B | $130,000 | |
| Previous Owner | Rooks Nancy | $102,338 |
Source: Public Records
Tax History Compared to Growth
Tax History
| Year | Tax Paid | Tax Assessment Tax Assessment Total Assessment is a certain percentage of the fair market value that is determined by local assessors to be the total taxable value of land and additions on the property. | Land | Improvement |
|---|---|---|---|---|
| 2024 | -- | $53,080 | $3,240 | $49,840 |
| 2023 | $0 | $53,080 | $3,240 | $49,840 |
| 2022 | $2,274 | $53,080 | $3,240 | $49,840 |
| 2021 | $1,608 | $53,080 | $3,240 | $49,840 |
| 2020 | $2,281 | $53,080 | $3,240 | $49,840 |
| 2019 | $2,281 | $53,080 | $3,240 | $49,840 |
| 2018 | $2,281 | $53,080 | $3,240 | $49,840 |
| 2017 | $2,281 | $53,080 | $3,240 | $49,840 |
| 2016 | -- | $53,080 | $3,240 | $49,840 |
| 2015 | $1,602 | $63,400 | $3,240 | $60,160 |
| 2014 | $1,895 | $63,400 | $3,240 | $60,160 |
| 2013 | -- | $63,400 | $3,240 | $60,160 |
Source: Public Records
Map
Nearby Homes
- 139 E Allen St
- 113 Beatty St
- 0 N A Unit 10613160
- 708 Georgia 118
- 569 Henry Hart Rd
- 110 Tom Holman Rd
- N/A Mclean Dr SE
- 101 Rose Ln
- 1339 Georgia 27
- 114 Water Front Rd
- 115 Cypress Ln
- 113 Cypress Ln
- 107 Oakridge Dr
- 108 N Spring Creek Cir
- TBD N Spring Creek Cir
- 0 N Spring Creek Cir
- 0 Statham Lake Front
- TBD Sawdust Trail
- 252 N Spring Creek Cir
- Lot # 2 Rose Landing
- 196 E Allen St
- 168 E Allen St
- 203 E Allen St
- 209 E Allen St
- 130 Holley Ave
- 213 E Allen St
- 119 Holley Ave
- 155 E Allen St
- 127 Holley Ave
- 131 Holley Ave
- 151 E Allen St
- 146 E Allen St
- 139 Holley Ave
- 111 Johnson St
- 548 Georgia 195
- 135 Holley Ave
- 160 Holley Ave
- 132 E Allen St
- 115 Johnson St
- 108 Laramore St