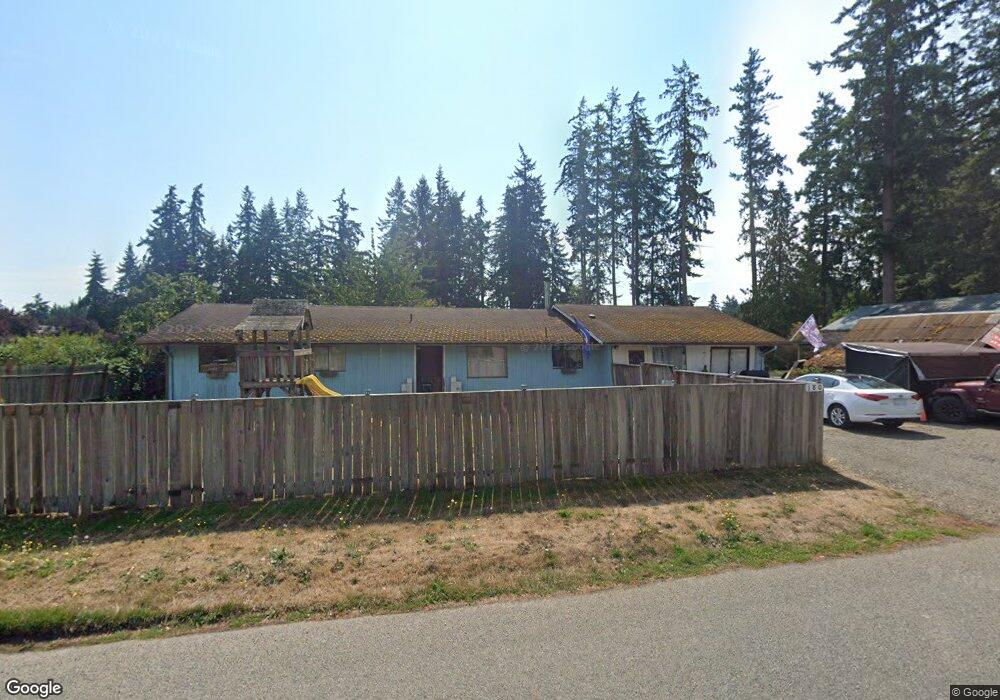
180 E Moore St Port Hadlock, WA 98339
Port Hadlock-Irondale NeighborhoodEstimated Value: $397,000 - $430,000
3
Beds
2
Baths
1,428
Sq Ft
$292/Sq Ft
Est. Value
About This Home
This home is located at 180 E Moore St, Port Hadlock, WA 98339 and is currently estimated at $417,354, approximately $292 per square foot. 180 E Moore St is a home located in Jefferson County with nearby schools including Chimacum Creek Primary School, Chimacum School Pi Program, and Chimacum Elementary School.
Ownership History
Date
Name
Owned For
Owner Type
Purchase Details
Closed on
Aug 3, 2011
Sold by
Pierrepont Roseanna T
Bought by
Pierrepont Robert J
Current Estimated Value
Home Financials for this Owner
Home Financials are based on the most recent Mortgage that was taken out on this home.
Original Mortgage
$151,182
Outstanding Balance
$104,138
Interest Rate
4.46%
Mortgage Type
VA
Estimated Equity
$313,216
Purchase Details
Closed on
Aug 2, 2011
Sold by
Federal National Mortgage Association
Bought by
Pierrepont Robert J
Home Financials for this Owner
Home Financials are based on the most recent Mortgage that was taken out on this home.
Original Mortgage
$151,182
Outstanding Balance
$104,138
Interest Rate
4.46%
Mortgage Type
VA
Estimated Equity
$313,216
Create a Home Valuation Report for This Property
The Home Valuation Report is an in-depth analysis detailing your home's value as well as a comparison with similar homes in the area
Home Values in the Area
Average Home Value in this Area
Purchase History
| Date | Buyer | Sale Price | Title Company |
|---|---|---|---|
| Pierrepont Robert J | -- | None Available | |
| Pierrepont Robert J | $148,000 | None Available |
Source: Public Records
Mortgage History
| Date | Status | Borrower | Loan Amount |
|---|---|---|---|
| Open | Pierrepont Robert J | $151,182 |
Source: Public Records
Tax History Compared to Growth
Tax History
| Year | Tax Paid | Tax Assessment Tax Assessment Total Assessment is a certain percentage of the fair market value that is determined by local assessors to be the total taxable value of land and additions on the property. | Land | Improvement |
|---|---|---|---|---|
| 2024 | $2,115 | $273,245 | $98,700 | $174,545 |
| 2023 | $2,115 | $255,611 | $89,000 | $166,611 |
| 2022 | $1,713 | $222,544 | $65,400 | $157,144 |
| 2021 | $1,667 | $182,447 | $57,730 | $124,717 |
| 2020 | $1,587 | $167,034 | $52,710 | $114,324 |
| 2019 | $1,525 | $154,131 | $50,200 | $103,931 |
| 2018 | $1,664 | $148,934 | $50,200 | $98,734 |
| 2017 | $1,518 | $143,738 | $50,200 | $93,538 |
| 2016 | $1,473 | $139,576 | $46,200 | $93,376 |
| 2015 | $1,450 | $139,576 | $46,200 | $93,376 |
| 2014 | -- | $139,576 | $46,200 | $93,376 |
| 2013 | -- | $126,885 | $42,000 | $84,885 |
Source: Public Records
Map
Nearby Homes
- 0 E Eugene St
- 52 E Moore St
- 371 E Price St
- 781 Irondale Rd
- 13 Loretta Ln
- 12 Loretta Ln
- 0 N Andrew Ave
- 31 2nd St
- 31 Petes Spur
- 32 S Duquesne Ave
- 0 S Duquesne Ave
- 51 Thomas Dr
- 1210 Irondale Rd
- 174 E Island View Ave
- 0 NKA C St
- 611 Cedar Ave Unit 51
- 611 Cedar Ave Unit 33
- 611 Cedar Ave Unit 62
- 593 Prospect Ave
- 999 Kala Lagoon Ct