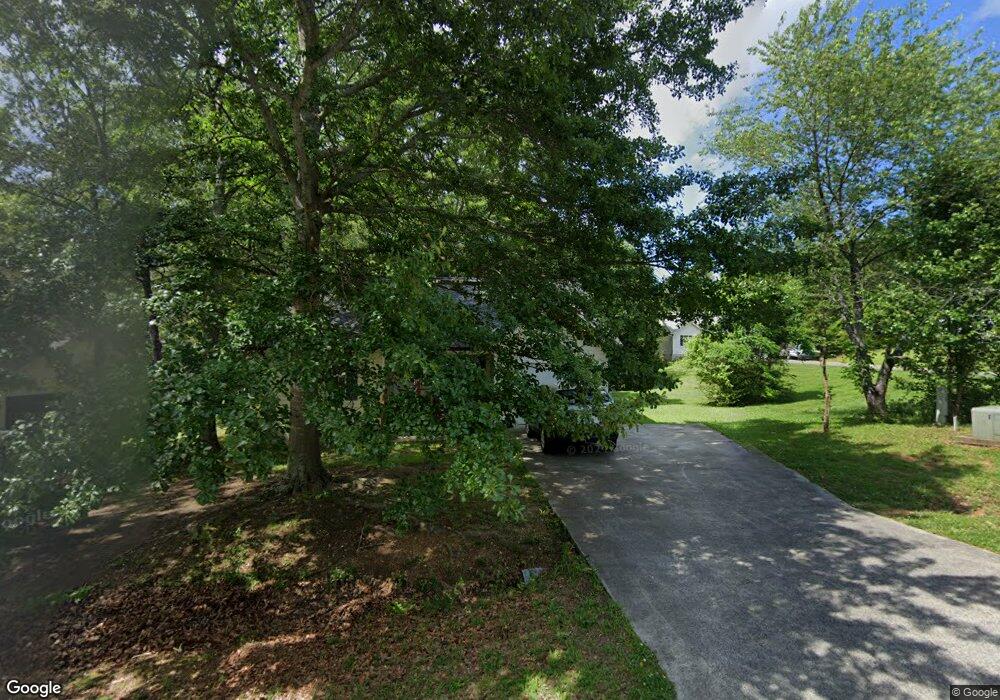
180 Frix Ln SE Calhoun, GA 30701
Estimated Value: $228,000 - $242,000
3
Beds
2
Baths
1,125
Sq Ft
$209/Sq Ft
Est. Value
About This Home
This home is located at 180 Frix Ln SE, Calhoun, GA 30701 and is currently estimated at $235,020, approximately $208 per square foot. 180 Frix Ln SE is a home located in Gordon County with nearby schools including Red Bud Elementary School, Red Bud Middle School, and Sonoraville High School.
Ownership History
Date
Name
Owned For
Owner Type
Purchase Details
Closed on
Feb 27, 2023
Sold by
Vibe Group Inc
Bought by
English J and Frix Place Trust
Current Estimated Value
Purchase Details
Closed on
Oct 14, 2022
Sold by
Barrett Carolyn Estate
Bought by
Vibe Grp Inc
Purchase Details
Closed on
Aug 25, 2010
Sold by
Secretary Of Housing & Urban Development
Bought by
Barrett Iris C
Purchase Details
Closed on
Nov 3, 2009
Sold by
Durdin Alisha
Bought by
M & T Bank
Purchase Details
Closed on
Nov 17, 2006
Sold by
Durdin James K
Bought by
Durdin Alisha
Purchase Details
Closed on
Jun 1, 1998
Bought by
Durdin James K
Purchase Details
Closed on
Dec 2, 1996
Bought by
Melton Shirley A
Create a Home Valuation Report for This Property
The Home Valuation Report is an in-depth analysis detailing your home's value as well as a comparison with similar homes in the area
Home Values in the Area
Average Home Value in this Area
Purchase History
| Date | Buyer | Sale Price | Title Company |
|---|---|---|---|
| English J | $203,000 | -- | |
| Vibe Grp Inc | $65,000 | -- | |
| Barrett Iris C | $35,523 | -- | |
| M & T Bank | $66,200 | -- | |
| Secretary Department Of Housing & Urban | $66,209 | -- | |
| M & T Bank | $66,209 | -- | |
| Durdin Alisha | -- | -- | |
| Durdin James K | $69,800 | -- | |
| Melton Shirley A | $63,700 | -- |
Source: Public Records
Tax History Compared to Growth
Tax History
| Year | Tax Paid | Tax Assessment Tax Assessment Total Assessment is a certain percentage of the fair market value that is determined by local assessors to be the total taxable value of land and additions on the property. | Land | Improvement |
|---|---|---|---|---|
| 2024 | $1,910 | $75,160 | $6,440 | $68,720 |
| 2023 | $1,456 | $57,320 | $6,440 | $50,880 |
| 2022 | $492 | $53,680 | $6,440 | $47,240 |
| 2021 | $402 | $44,240 | $6,440 | $37,800 |
| 2020 | $372 | $40,800 | $5,880 | $34,920 |
| 2019 | $374 | $40,800 | $5,880 | $34,920 |
| 2018 | $309 | $34,080 | $5,040 | $29,040 |
| 2017 | $322 | $34,780 | $5,040 | $29,740 |
| 2016 | $290 | $31,404 | $4,760 | $26,644 |
| 2015 | $924 | $30,804 | $4,760 | $26,044 |
| 2014 | $752 | $25,835 | $4,200 | $21,635 |
Source: Public Records
Map
Nearby Homes
- 177 Frix Ln SE
- 191 Frix Ln SE
- 0 Buck Blvd SE Unit 7362017
- 0 Buck Blvd SE Unit 10275210
- 0 Libby Ln SE Unit 10275212
- 0 Libby Ln SE Unit 7362041
- 4134 Dews Pond Rd SE
- 192 Cardinal Blvd SE
- 194 Cardinal Blvd SE
- 408 Peachtree Ln SE
- 0 Covington Bridge Rd SE Unit 10558075
- 0 Covington Bridge Rd SE Unit 7610123
- 702 Cash Rd SE
- 137 Hunters Trail SE
- 00002 Lovebridge Rd SE
- lot 4 Lovebridge Rd SE
- 0 Hunts Gin Rd L2
- 127 Alex Ct
- 153 Oakland Dr SE
- 478 Oakland Dr SE
- 170 Frix Ln SE
- 190 Frix Ln SE
- 160 Frix Ln SE
- 200 Frix Ln SE
- 150 Frix Ln SE
- 206 Frix Ln SE
- 163 Frix Ln SE
- 181 Prater Dr SE
- 171 Prater Dr SE
- 191 Prater Dr SE
- 161 Prater Dr SE
- 201 Prater Dr SE
- 140 Frix Ln SE
- 153 Frix Ln SE
- 205 Frix Ln SE
- 210 Frix Ln SE
- 210 Frix Ln SE
- 0 Prater Dr SE Unit 8859440
- 211 Prater Dr SE
- 151 Prater Dr SE