Estimated Value: $572,793 - $632,000
4
Beds
3
Baths
1,863
Sq Ft
$322/Sq Ft
Est. Value
About This Home
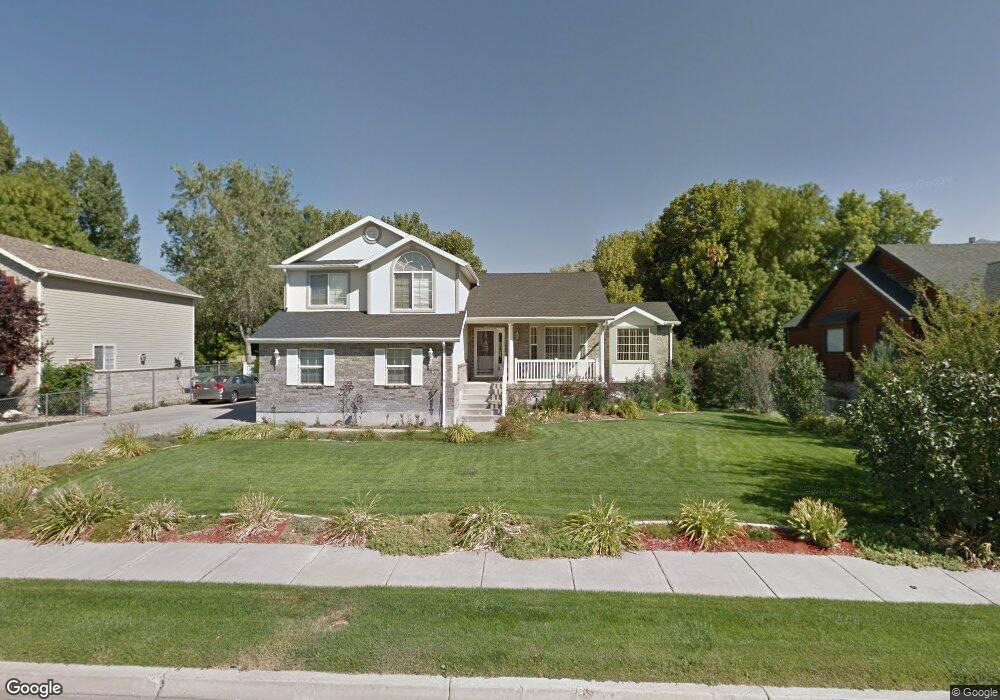
This home is located at 180 Harper Way, Ogden, UT 84405 and is currently estimated at $600,198, approximately $322 per square foot. 180 Harper Way is a home located in Davis County with nearby schools including South Weber Elementary School, Sunset Junior High School, and Northridge High School.
Ownership History
Date
Name
Owned For
Owner Type
Purchase Details
Closed on
Mar 16, 2009
Sold by
Maycock Leanne
Bought by
Maycock Leanne
Current Estimated Value
Home Financials for this Owner
Home Financials are based on the most recent Mortgage that was taken out on this home.
Original Mortgage
$208,916
Outstanding Balance
$132,695
Interest Rate
5.19%
Mortgage Type
FHA
Estimated Equity
$467,503
Purchase Details
Closed on
Nov 3, 1999
Sold by
Nilson & Company Inc
Bought by
Maycock Leanne
Home Financials for this Owner
Home Financials are based on the most recent Mortgage that was taken out on this home.
Original Mortgage
$179,755
Interest Rate
7.75%
Purchase Details
Closed on
Jul 6, 1998
Sold by
Holmes Randy V and Holmes Susan L
Bought by
Maycock Leanne
Home Financials for this Owner
Home Financials are based on the most recent Mortgage that was taken out on this home.
Original Mortgage
$25,500
Interest Rate
7.03%
Purchase Details
Closed on
Sep 12, 1997
Sold by
Ed Green Construction Inc and Harper Tracy R
Bought by
Holmes Randy and Holmes Susan L
Create a Home Valuation Report for This Property
The Home Valuation Report is an in-depth analysis detailing your home's value as well as a comparison with similar homes in the area
Home Values in the Area
Average Home Value in this Area
Purchase History
| Date | Buyer | Sale Price | Title Company |
|---|---|---|---|
| Maycock Leanne | -- | Meridian Title Company | |
| Maycock Leanne | -- | Bonneville Title Company Inc | |
| Nilson & Company Inc | -- | Bonneville Title Company Inc | |
| Maycock Leanne | -- | U S Title Of Utah | |
| Holmes Randy | -- | Security Title Company |
Source: Public Records
Mortgage History
| Date | Status | Borrower | Loan Amount |
|---|---|---|---|
| Open | Maycock Leanne | $208,916 | |
| Closed | Maycock Leanne | $179,755 | |
| Previous Owner | Maycock Leanne | $25,500 |
Source: Public Records
Tax History Compared to Growth
Tax History
| Year | Tax Paid | Tax Assessment Tax Assessment Total Assessment is a certain percentage of the fair market value that is determined by local assessors to be the total taxable value of land and additions on the property. | Land | Improvement |
|---|---|---|---|---|
| 2025 | $2,970 | $295,900 | $130,167 | $165,733 |
| 2024 | $2,742 | $278,300 | $107,056 | $171,244 |
| 2023 | $2,818 | $517,000 | $172,878 | $344,122 |
| 2022 | $3,040 | $306,900 | $89,450 | $217,450 |
| 2021 | $2,595 | $400,000 | $131,988 | $268,012 |
| 2020 | $2,357 | $354,000 | $122,199 | $231,801 |
| 2019 | $2,292 | $336,000 | $115,759 | $220,241 |
| 2018 | $2,161 | $333,000 | $105,258 | $227,742 |
| 2016 | $1,830 | $147,290 | $44,906 | $102,384 |
| 2015 | $1,770 | $134,805 | $44,906 | $89,899 |
| 2014 | $1,691 | $131,095 | $51,616 | $79,479 |
| 2013 | -- | $122,810 | $41,670 | $81,140 |
Source: Public Records
Map
Nearby Homes
- 73 W Harper Way Unit 108
- 329 E Kingston Dr
- 6471 S Aspen Ln
- 6539 S Liberty Way
- 6562 S Aspen Ln
- 5530 S 100 W
- 589 E Green Springs Way
- 649 E 5650 S
- 5488 S 250 E
- 5415 S 300 W
- 5495 S 575 W
- 5522 S 600 E
- 6899 S Cook Dr
- 232 W 5250 S
- 233 W 5200 S
- 975 E 6600 S Unit 18
- 112 W 5150 S
- 856 E 5575 S
- 405 W 5100 S
- 5331 S 750 E
- 166 Harper Way
- 192 Harper Way
- 154 Harper Way
- 154 Harper Way Unit 12
- 6366 Raymond Dr
- 6363 Raymond Dr
- 142 Harper Way
- 151 Harper Way
- 134 Harper Way
- 6381 Raymond Dr
- 137 Harper Way
- 6390 Raymond Dr
- 129 Harper Way
- 6393 Raymond Dr
- 6402 Raymond Dr
- 117 Harper Way
- 110 Harper Way
- 6415 Raymond Dr
- 6422 Raymond Dr
- 103 Harper Way