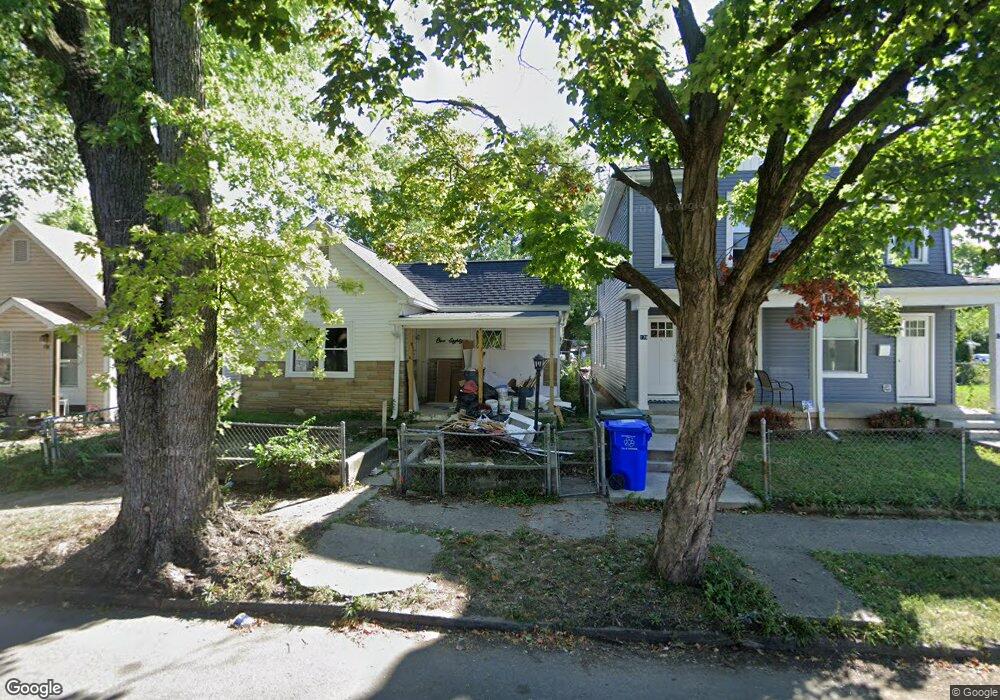
180 Hayden Ave Unit Front Columbus, OH 43222
Franklinton NeighborhoodEstimated Value: $140,709 - $183,000
3
Beds
1
Bath
1,150
Sq Ft
$139/Sq Ft
Est. Value
About This Home
This home is located at 180 Hayden Ave Unit Front, Columbus, OH 43222 and is currently estimated at $160,177, approximately $139 per square foot. 180 Hayden Ave Unit Front is a home located in Franklin County with nearby schools including Starling PK-8, West High School, and Central High School.
Ownership History
Date
Name
Owned For
Owner Type
Purchase Details
Closed on
Aug 15, 2023
Sold by
Myers Chris
Bought by
2D Walls Investments Llc
Current Estimated Value
Purchase Details
Closed on
Jul 27, 2023
Sold by
Myers Chris
Bought by
2D Walls Investments Llc
Purchase Details
Closed on
Feb 22, 2023
Sold by
2D Walls Investments Llc
Bought by
Myers Chris
Purchase Details
Closed on
Feb 10, 2023
Sold by
2D Walls Investments Llc
Bought by
Myers Chris
Purchase Details
Closed on
Jan 31, 2016
Sold by
Lutz Sheila M
Bought by
Fields Twila L
Home Financials for this Owner
Home Financials are based on the most recent Mortgage that was taken out on this home.
Original Mortgage
$40,000
Interest Rate
3.95%
Mortgage Type
Seller Take Back
Purchase Details
Closed on
Oct 29, 1974
Bought by
Fillinger Frances E
Create a Home Valuation Report for This Property
The Home Valuation Report is an in-depth analysis detailing your home's value as well as a comparison with similar homes in the area
Home Values in the Area
Average Home Value in this Area
Purchase History
| Date | Buyer | Sale Price | Title Company |
|---|---|---|---|
| 2D Walls Investments Llc | -- | Columbus Title | |
| 2D Walls Investments Llc | -- | Columbus Title | |
| Myers Chris | $36,000 | Landsel Title Agency | |
| Myers Chris | $36,000 | Landsel Title Agency | |
| Fields Twila L | $45,000 | Attorney | |
| Fillinger Frances E | -- | -- |
Source: Public Records
Mortgage History
| Date | Status | Borrower | Loan Amount |
|---|---|---|---|
| Previous Owner | Fields Twila L | $40,000 |
Source: Public Records
Map
Nearby Homes
- 154-156 N Central Ave
- 121-123 Hayden Ave
- 95-97 N Central Ave
- 91-93 N Central Ave
- 130 Chicago Ave
- 63 Hayden Ave
- 137 Wisconsin Ave
- 69 Chicago Ave
- 158 Wisconsin Ave
- 92 Stevens Ave
- 57 N Guilford Ave
- 48 N Guilford Ave
- 85-87 N Yale Ave
- 101 Stevens Ave Unit 103
- 63 Stevens Ave
- 57 Stevens Ave Unit 59
- 44 Brehl Ave
- 33 S Princeton Ave
- 46 W Park Ave
- 82 N Princeton Ave
- 180 Hayden Ave
- 180 Hayden Ave
- 184 Hayden Ave
- 174 Hayden Ave Unit 176
- 174-176 Hayden Ave
- 192 Hayden Ave
- 164 Hayden Ave
- 185 Hayden Ave
- 200 Hayden Ave
- 179 Hayden Ave
- 177 Hayden Ave
- 154 Hayden Ave
- 169 Hayden Ave
- 189 Hayden Ave
- 165 Hayden Ave
- 179 N Princeton Ave
- 173 N Princeton Ave
- 161 Hayden Ave
- 191 Hayden Ave Unit 195
- 150 Hayden Ave Unit 152
Your Personal Tour Guide
Ask me questions while you tour the home.