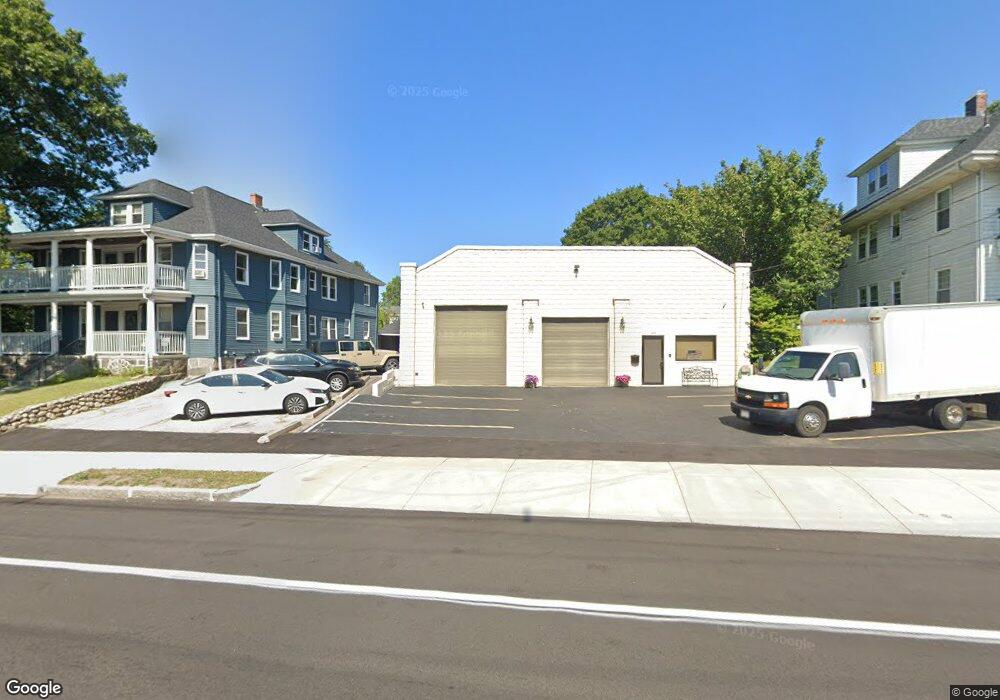
180 Independence Ave Quincy, MA 02169
South Quincy NeighborhoodEstimated Value: $601,097
Studio
1
Bath
4,400
Sq Ft
$137/Sq Ft
Est. Value
About This Home
This home is located at 180 Independence Ave, Quincy, MA 02169 and is currently estimated at $601,097, approximately $136 per square foot. 180 Independence Ave is a home located in Norfolk County with nearby schools including Lincoln-Hancock Community School, South West Middle School, and Quincy High School.
Ownership History
Date
Name
Owned For
Owner Type
Purchase Details
Closed on
Aug 11, 1998
Sold by
Zanghi Carmen J
Bought by
Perniola Tr Domenic A
Current Estimated Value
Create a Home Valuation Report for This Property
The Home Valuation Report is an in-depth analysis detailing your home's value as well as a comparison with similar homes in the area
Home Values in the Area
Average Home Value in this Area
Purchase History
| Date | Buyer | Sale Price | Title Company |
|---|---|---|---|
| Perniola Tr Domenic A | $150,000 | -- | |
| Perniola Tr Domenic A | $150,000 | -- |
Source: Public Records
Mortgage History
| Date | Status | Borrower | Loan Amount |
|---|---|---|---|
| Open | Perniola Tr Domenic A | $275,000 | |
| Closed | Perniola Tr Domenic A | $120,000 | |
| Previous Owner | Perniola Tr Domenic A | $230,000 |
Source: Public Records
Tax History
| Year | Tax Paid | Tax Assessment Tax Assessment Total Assessment is a certain percentage of the fair market value that is determined by local assessors to be the total taxable value of land and additions on the property. | Land | Improvement |
|---|---|---|---|---|
| 2025 | $13,652 | $593,300 | $265,600 | $327,700 |
| 2024 | $12,213 | $544,000 | $263,000 | $281,000 |
| 2023 | $11,518 | $519,300 | $260,400 | $258,900 |
| 2022 | $11,477 | $481,000 | $248,100 | $232,900 |
| 2021 | $10,662 | $440,200 | $245,500 | $194,700 |
| 2020 | $10,545 | $424,500 | $243,100 | $181,400 |
| 2019 | $10,475 | $416,000 | $240,800 | $175,200 |
| 2018 | $11,249 | $416,000 | $238,300 | $177,700 |
| 2017 | $11,849 | $412,700 | $231,400 | $181,300 |
| 2016 | $11,877 | $404,400 | $231,400 | $173,000 |
| 2015 | $12,231 | $404,200 | $231,400 | $172,800 |
| 2014 | $12,280 | $393,200 | $231,400 | $161,800 |
Source: Public Records
Map
Nearby Homes
- 99 Verchild St
- 11 Oak Grove Terrace Unit 301
- 9 Independence Ave Unit 102
- 9 Independence Ave Unit 307
- 56 Penn St Unit 4
- 21 Totman St Unit 205
- 21 Totman St Unit 409
- 21 Totman St Unit 203
- 21 Totman St Unit 403
- 21 Totman St Unit 301
- 21 Totman St Unit 208
- 21 Totman St Unit PH-401
- 21 Totman St Unit 204
- 202 Kendrick Ave
- 17 White Rd
- 155 Kendrick Ave Unit 502
- 51 Branch St Unit 3
- 79 Gilbert St
- 8 Jackson St Unit B1
- 8 Jackson St Unit B4
- 186 Independence Ave
- 186 Independence Ave Unit 1
- 184 Independence Ave
- 15 Pembroke St
- 15 Pembroke St Unit 15
- 15 Pembroke St Unit 1
- 11 Pembroke St
- 17 Pembroke St Unit 1
- 25 Pembroke St
- 166 Independence Ave
- 166 Independence Ave Unit 1
- 177 Independence Ave
- 194 Independence Ave
- 29 Pembroke St
- 59 Lurton St
- 116 Verchild St
- 187 Independence Ave
- 33 Pembroke St
- 191 Independence Ave
- 175 Independence Ave
Your Personal Tour Guide
Ask me questions while you tour the home.