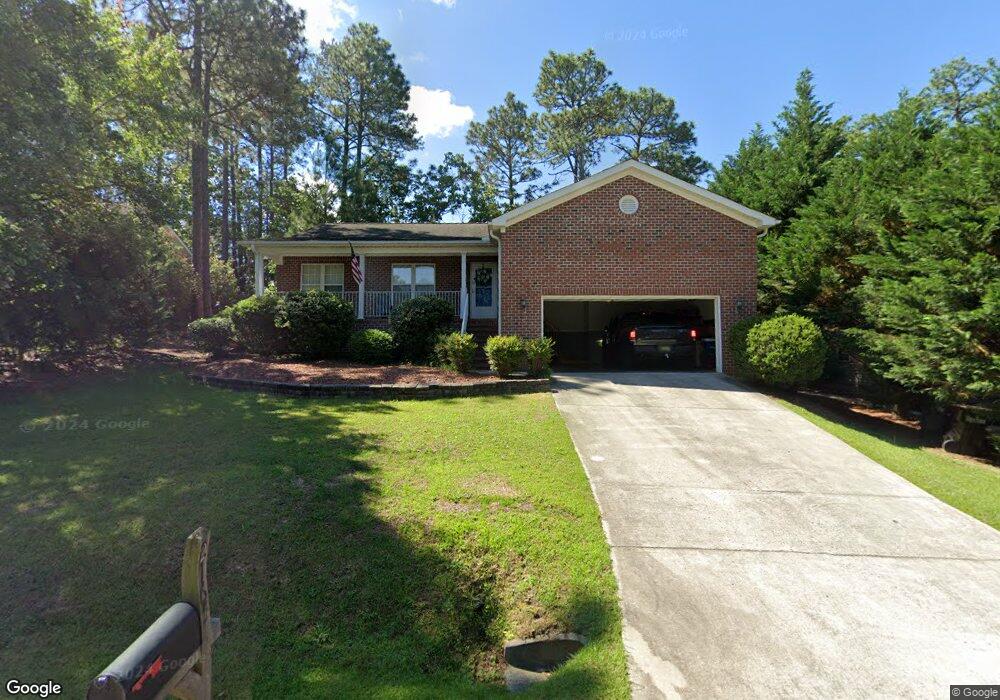
180 Longleaf Dr W Unit 3 Pinehurst, NC 28374
Estimated Value: $346,000 - $401,000
3
Beds
2
Baths
1,537
Sq Ft
$239/Sq Ft
Est. Value
About This Home
This home is located at 180 Longleaf Dr W Unit 3, Pinehurst, NC 28374 and is currently estimated at $367,729, approximately $239 per square foot. 180 Longleaf Dr W Unit 3 is a home located in Moore County with nearby schools including Pinehurst Elementary School, West Pine Middle School, and Pinecrest High School.
Ownership History
Date
Name
Owned For
Owner Type
Purchase Details
Closed on
Aug 16, 2018
Sold by
Holk Thomas and Holk Alicia
Bought by
Brady Madison
Current Estimated Value
Home Financials for this Owner
Home Financials are based on the most recent Mortgage that was taken out on this home.
Original Mortgage
$170,100
Outstanding Balance
$145,860
Interest Rate
4.5%
Mortgage Type
VA
Estimated Equity
$221,869
Purchase Details
Closed on
Nov 18, 2010
Sold by
Carre John Steven and Carre Mia
Bought by
Holk Thomas
Home Financials for this Owner
Home Financials are based on the most recent Mortgage that was taken out on this home.
Original Mortgage
$181,724
Interest Rate
4.33%
Mortgage Type
VA
Purchase Details
Closed on
Jun 2, 2006
Sold by
Quality Built Homes Inc
Bought by
Carre John Steven and Carre Mia L
Home Financials for this Owner
Home Financials are based on the most recent Mortgage that was taken out on this home.
Original Mortgage
$121,600
Interest Rate
6.74%
Mortgage Type
Purchase Money Mortgage
Create a Home Valuation Report for This Property
The Home Valuation Report is an in-depth analysis detailing your home's value as well as a comparison with similar homes in the area
Home Values in the Area
Average Home Value in this Area
Purchase History
| Date | Buyer | Sale Price | Title Company |
|---|---|---|---|
| Brady Madison | $189,000 | None Available | |
| Holk Thomas | $178,000 | None Available | |
| Carre John Steven | $152,000 | None Available |
Source: Public Records
Mortgage History
| Date | Status | Borrower | Loan Amount |
|---|---|---|---|
| Open | Brady Madison | $170,100 | |
| Previous Owner | Holk Thomas | $181,724 | |
| Previous Owner | Carre John Steven | $121,600 |
Source: Public Records
Tax History
| Year | Tax Paid | Tax Assessment Tax Assessment Total Assessment is a certain percentage of the fair market value that is determined by local assessors to be the total taxable value of land and additions on the property. | Land | Improvement |
|---|---|---|---|---|
| 2025 | $1,716 | $307,850 | $55,000 | $252,850 |
| 2024 | $1,762 | $307,850 | $55,000 | $252,850 |
| 2023 | $1,839 | $307,850 | $55,000 | $252,850 |
| 2022 | $1,662 | $199,030 | $30,000 | $169,030 |
| 2021 | $1,722 | $199,030 | $30,000 | $169,030 |
| 2020 | $1,704 | $199,030 | $30,000 | $169,030 |
| 2019 | $1,704 | $199,030 | $30,000 | $169,030 |
| 2018 | $1,461 | $182,640 | $26,500 | $156,140 |
| 2017 | $1,443 | $182,640 | $26,500 | $156,140 |
| 2015 | $1,415 | $182,640 | $26,500 | $156,140 |
| 2014 | $1,282 | $167,640 | $26,500 | $141,140 |
| 2013 | -- | $167,640 | $26,500 | $141,140 |
Source: Public Records
Map
Nearby Homes
- 4405 Murdocksville
- 4285 Murdocksville Rd
- 85 Woods Rd
- 30 Medlin Rd
- 4115 Murdocksville Rd
- 123 Lark Dr
- 44 Spring Lake Dr
- 55 McCaskill Rd E
- 1 Prichard Ln
- 20 Bradley Ln Unit 15
- 60 Spring Lake Dr
- 190 Palmetto Rd Unit 21
- 190 Palmetto Rd
- 25 Mcleod Rd
- 16 Moore Dr
- 123 Lark Dr
- 12 Barrett Rd E
- 1665 Longleaf Dr E Unit 9
- 20 Fields Rd
- 40 Harlow Rd
- 2165 Longleaf Dr SW
- 170 Longleaf Dr W
- 2175 Longleaf Dr SW
- 2360 Longleaf Dr SW
- 2380 Longleaf Dr SW
- 160 Longleaf Dr W Unit 3
- 200 Longleaf Dr W Unit 3
- 2145 Longleaf Dr SW
- 2185 Longleaf Dr SW
- 2150 Longleaf Dr SW
- 2160 Longleaf Dr W
- 175 Longleaf Dr W
- 2170 Longleaf Dr SW
- 165 Longleaf Dr W
- 2195 Longleaf Dr W
- 2170 Longleaf Dr W
- 150 Longleaf Dr W Unit 3
- 2135 Longleaf Dr SW
- 210 Longleaf Dr W
- 2195 Longleaf Dr W
Your Personal Tour Guide
Ask me questions while you tour the home.