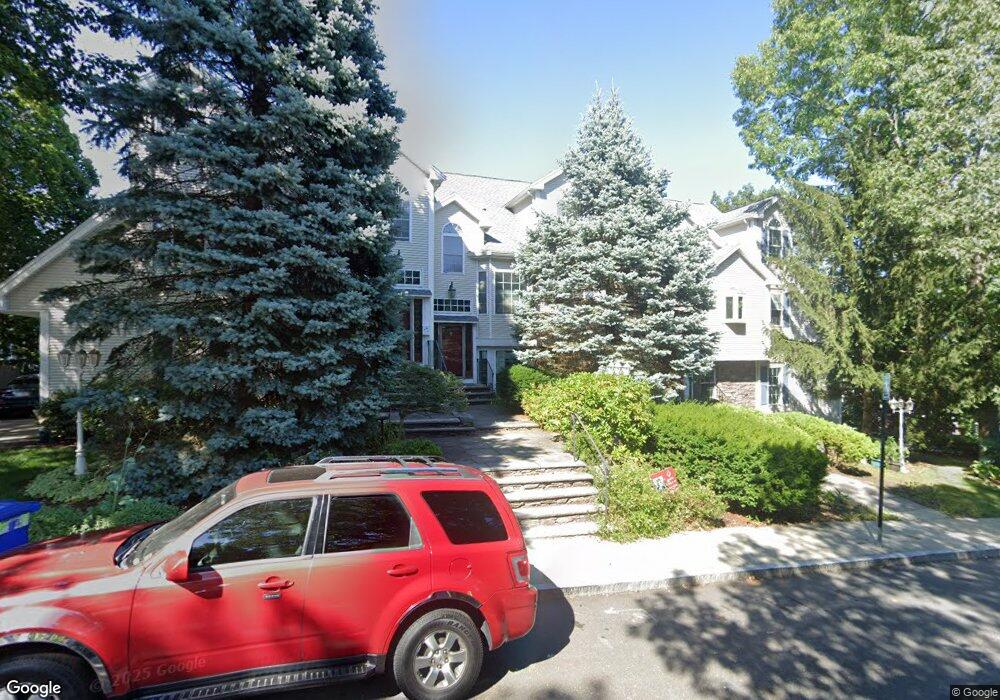
180 Monroe Rd Unit 1 Quincy, MA 02169
Quincy Center NeighborhoodEstimated Value: $814,215 - $938,000
3
Beds
3
Baths
2,247
Sq Ft
$380/Sq Ft
Est. Value
About This Home
This home is located at 180 Monroe Rd Unit 1, Quincy, MA 02169 and is currently estimated at $854,054, approximately $380 per square foot. 180 Monroe Rd Unit 1 is a home located in Norfolk County with nearby schools including Charles A. Bernazzani Elementary School, Central Middle School, and Quincy High School.
Ownership History
Date
Name
Owned For
Owner Type
Purchase Details
Closed on
Jun 27, 2011
Sold by
Kim Richard H
Bought by
Richmond David H and Reynolds Jan
Current Estimated Value
Home Financials for this Owner
Home Financials are based on the most recent Mortgage that was taken out on this home.
Original Mortgage
$364,800
Outstanding Balance
$232,391
Interest Rate
3%
Mortgage Type
Purchase Money Mortgage
Estimated Equity
$621,663
Purchase Details
Closed on
May 15, 2002
Sold by
Har-Evan Reuven
Bought by
Kim Richard H
Home Financials for this Owner
Home Financials are based on the most recent Mortgage that was taken out on this home.
Original Mortgage
$300,700
Interest Rate
7.15%
Mortgage Type
Purchase Money Mortgage
Purchase Details
Closed on
May 1, 2001
Sold by
Cliff Vw Rt
Bought by
Har-Even Reuven
Home Financials for this Owner
Home Financials are based on the most recent Mortgage that was taken out on this home.
Original Mortgage
$355,000
Interest Rate
6.88%
Mortgage Type
Purchase Money Mortgage
Create a Home Valuation Report for This Property
The Home Valuation Report is an in-depth analysis detailing your home's value as well as a comparison with similar homes in the area
Home Values in the Area
Average Home Value in this Area
Purchase History
| Date | Buyer | Sale Price | Title Company |
|---|---|---|---|
| Richmond David H | $456,600 | -- | |
| Hareven Reuven | -- | -- | |
| Kim Richard H | $485,000 | -- | |
| Har-Even Reuven | $444,000 | -- |
Source: Public Records
Mortgage History
| Date | Status | Borrower | Loan Amount |
|---|---|---|---|
| Open | Hareven Reuven | $364,800 | |
| Closed | Hareven Reuven | $364,800 | |
| Previous Owner | Kim Richard H | $300,700 | |
| Previous Owner | Har-Even Reuven | $355,000 |
Source: Public Records
Tax History Compared to Growth
Tax History
| Year | Tax Paid | Tax Assessment Tax Assessment Total Assessment is a certain percentage of the fair market value that is determined by local assessors to be the total taxable value of land and additions on the property. | Land | Improvement |
|---|---|---|---|---|
| 2025 | $8,401 | $728,600 | $0 | $728,600 |
| 2024 | $7,838 | $695,500 | $0 | $695,500 |
| 2023 | $7,243 | $650,800 | $0 | $650,800 |
| 2022 | $7,260 | $606,000 | $0 | $606,000 |
| 2021 | $6,974 | $574,500 | $0 | $574,500 |
| 2020 | $7,098 | $571,000 | $0 | $571,000 |
| 2019 | $6,877 | $548,000 | $0 | $548,000 |
| 2018 | $6,774 | $507,800 | $0 | $507,800 |
| 2017 | $6,761 | $477,100 | $0 | $477,100 |
| 2016 | $6,494 | $452,200 | $0 | $452,200 |
| 2015 | $6,605 | $452,400 | $0 | $452,400 |
| 2014 | $6,258 | $421,100 | $0 | $421,100 |
Source: Public Records
Map
Nearby Homes
- 195 Thomas Burgin Pkwy Unit 205
- 118 Dimmock St
- 215 Thomas Burgin Pkwy Unit 35
- 293 Whitwell St
- 73 Cranch St Unit 73
- 73 Scotch Pond Place
- 20 Whitney Rd
- 20 Whitney Rd Unit 307
- 20 Whitney Rd Unit 101
- 1 Adams St Unit 502
- 77 Adams St Unit 610
- 18 Cliveden St Unit 201W
- 2 Cliveden St Unit 601E
- 40 Greenleaf St Unit 102
- 165 Granite St
- 1025 Hancock St Unit 12K
- 1025 Hancock St Unit 1F
- 1025 Hancock St Unit 1K
- 36 Bigelow St
- 33 Brook Rd
- 180 Monroe Rd Unit 3
- 180 Monroe Rd Unit 2
- 149 Presidents Ln
- 185 Monroe Rd
- 4 Avon Way
- 158 Presidents Ln
- 154 Presidents Ln
- 145 Presidents Ln
- 162 Presidents Ln
- 162 Monroe Rd
- 166 Presidents Ln
- 148 Presidents Ln Unit 9
- 148 Presidents Ln Unit 8
- 148 Presidents Ln Unit 7
- 148 Presidents Ln Unit 6
- 148 Presidents Ln Unit 5
- 148 Presidents Ln Unit 4
- 148 Presidents Ln Unit 3
- 148 Presidents Ln Unit 2
- 148 Presidents Ln Unit 10