180 N 500 W Bountiful, UT 84010
Estimated Value: $650,000
3
Beds
2
Baths
1,060
Sq Ft
$613/Sq Ft
Est. Value
About This Home
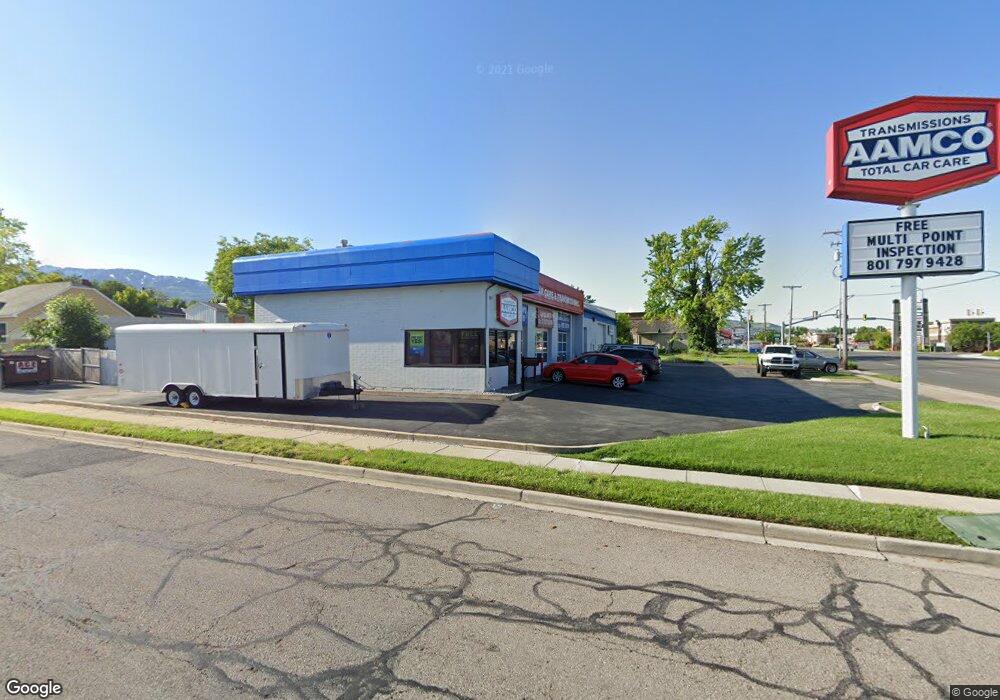
This home is located at 180 N 500 W, Bountiful, UT 84010 and is currently priced at $650,000, approximately $613 per square foot. 180 N 500 W is a home located in Davis County with nearby schools including Meadowbrook Elementary School, Bountiful Junior High School, and Bountiful High School.
Ownership History
Date
Name
Owned For
Owner Type
Purchase Details
Closed on
Jan 16, 2015
Sold by
Jolley Car Wash Llc
Bought by
Pm Bountiful Investments Llc
Current Estimated Value
Home Financials for this Owner
Home Financials are based on the most recent Mortgage that was taken out on this home.
Original Mortgage
$537,000
Outstanding Balance
$408,895
Interest Rate
3.76%
Mortgage Type
Commercial
Purchase Details
Closed on
Jan 30, 1998
Sold by
Thurgood Robert L and Thurgood Beverly S
Bought by
Jolley Dean L and Jolley Celia R
Home Financials for this Owner
Home Financials are based on the most recent Mortgage that was taken out on this home.
Original Mortgage
$515,000
Interest Rate
7.05%
Mortgage Type
Commercial
Purchase Details
Closed on
Nov 26, 1996
Sold by
Thurgood Robert L and Thurgood Beverly S
Bought by
Thurgood Robert L and Thurgood Beverly S
Create a Home Valuation Report for This Property
The Home Valuation Report is an in-depth analysis detailing your home's value as well as a comparison with similar homes in the area
Purchase History
| Date | Buyer | Sale Price | Title Company |
|---|---|---|---|
| Pm Bountiful Investments Llc | -- | Meridian Title Co | |
| Jolley Car Wash Llc | -- | Meridian Title Co | |
| Jolley Dean L | -- | Bonneville Title Company Inc | |
| Thurgood Robert L | -- | -- |
Source: Public Records
Mortgage History
| Date | Status | Borrower | Loan Amount |
|---|---|---|---|
| Open | Jolley Car Wash Llc | $537,000 | |
| Closed | Pm Bountiful Investments Llc | $537,000 | |
| Previous Owner | Jolley Dean L | $515,000 |
Source: Public Records
Tax History
| Year | Tax Paid | Tax Assessment Tax Assessment Total Assessment is a certain percentage of the fair market value that is determined by local assessors to be the total taxable value of land and additions on the property. | Land | Improvement |
|---|---|---|---|---|
| 2025 | $6,800 | $610,044 | $294,068 | $315,976 |
| 2024 | $6,307 | $471,129 | $264,854 | $206,275 |
| 2023 | $6,050 | $447,051 | $240,776 | $206,275 |
| 2022 | $6,072 | $812,821 | $437,775 | $375,046 |
| 2021 | $6,283 | $682,969 | $307,923 | $375,046 |
| 2020 | $6,424 | $706,924 | $367,224 | $339,700 |
| 2019 | $6,307 | $706,924 | $367,224 | $339,700 |
| 2018 | $6,129 | $680,000 | $374,300 | $305,700 |
| 2016 | $4,210 | $310,419 | $205,865 | $104,554 |
| 2015 | $4,008 | $269,642 | $205,865 | $63,777 |
| 2014 | $3,786 | $269,642 | $205,865 | $63,777 |
| 2013 | -- | $269,642 | $205,865 | $63,777 |
Source: Public Records
Map
Nearby Homes
- 449 W 200 N Unit 3
- 290 N 500 W Unit 108
- 290 N 500 W Unit 305
- 399 W 400 N Unit 47
- 401 W 400 N Unit 49
- 75 N Peregrine Ln W Unit 8
- 332 N 300 W
- 320 N 200 W Unit 4
- 499 N 200 W Unit 30
- 563 N 200 W
- 106 W 700 N
- 252 N Main St
- 254 N Main St
- 256 N Main St
- 366 W 1000 N
- 51 E 200 N Unit 3
- 184 Park Shadows Cir
- 55 E 200 N Unit 2
- 41 E 200 N Unit 6
- 49 E 200 N Unit 4
- 457 W 200 N Unit 1
- 455 W 200 N Unit 4
- 478 W 200 N
- 110 N 500 W
- 466 W 200 N
- 453 W 200 N Unit 3
- 453 W 200 N Unit 2
- 453 W 200 N Unit 1
- 453 W 200 N
- 447 W 200 N
- 451 W 200 N Unit 4
- 451 W 200 N Unit 3
- 451 W 200 N Unit 2
- 451 W 200 N Unit 1
- 451 W 200 N
- 449 W 200 N Unit 2
- 449 W 200 N Unit 1
- 449 W 200 N
- 440 W 200 N
- 441 W 200 N
Your Personal Tour Guide
Ask me questions while you tour the home.