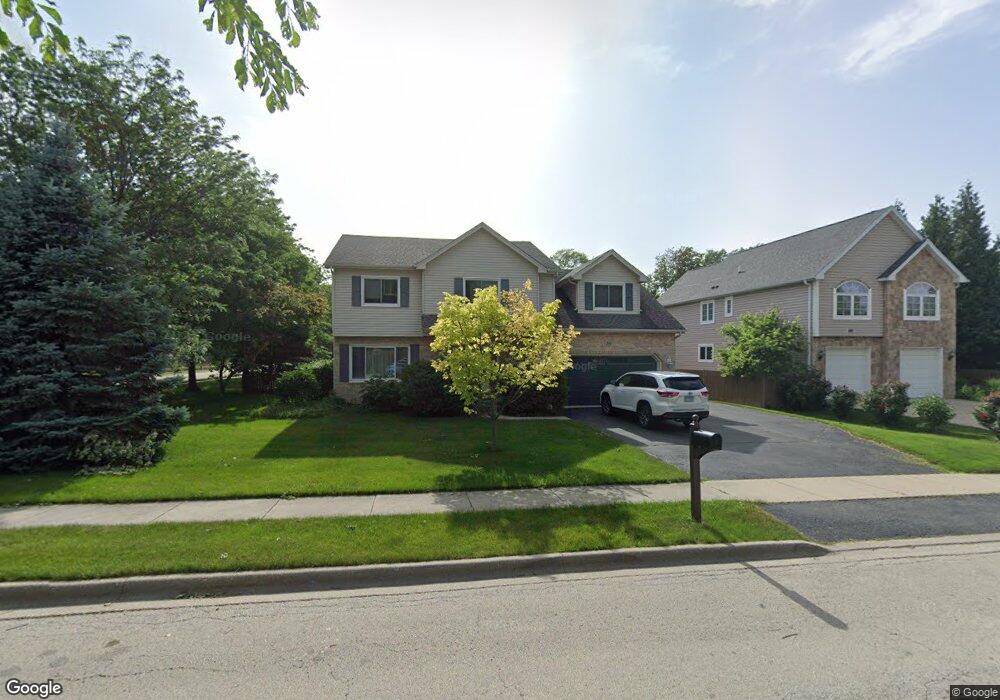
180 N Glenview Ave Elmhurst, IL 60126
Estimated Value: $749,000 - $943,000
--
Bed
--
Bath
2,433
Sq Ft
$342/Sq Ft
Est. Value
About This Home
This home is located at 180 N Glenview Ave, Elmhurst, IL 60126 and is currently estimated at $831,122, approximately $341 per square foot. 180 N Glenview Ave is a home located in DuPage County with nearby schools including Reinberg Elementary School, Ruggles Elementary School, and Hawthorne Elementary School.
Ownership History
Date
Name
Owned For
Owner Type
Purchase Details
Closed on
Aug 5, 2020
Sold by
Starr Tamra D and Depaul Anthony F
Bought by
Depaul Anthony F and Starr Depaul Tamra
Current Estimated Value
Purchase Details
Closed on
May 23, 2000
Sold by
Chavez Michael and Chavez Susan M
Bought by
Starr Tamra D and Depaul Anthony F
Home Financials for this Owner
Home Financials are based on the most recent Mortgage that was taken out on this home.
Original Mortgage
$280,000
Outstanding Balance
$94,011
Interest Rate
7.75%
Estimated Equity
$737,111
Purchase Details
Closed on
Apr 14, 1995
Sold by
West Suburban Bank
Bought by
Chavez Michael and Chavez Susan M
Home Financials for this Owner
Home Financials are based on the most recent Mortgage that was taken out on this home.
Original Mortgage
$218,000
Interest Rate
8.75%
Create a Home Valuation Report for This Property
The Home Valuation Report is an in-depth analysis detailing your home's value as well as a comparison with similar homes in the area
Home Values in the Area
Average Home Value in this Area
Purchase History
| Date | Buyer | Sale Price | Title Company |
|---|---|---|---|
| Depaul Anthony F | -- | Attorney | |
| Starr Tamra D | $350,000 | -- | |
| Chavez Michael | $243,000 | -- |
Source: Public Records
Mortgage History
| Date | Status | Borrower | Loan Amount |
|---|---|---|---|
| Open | Starr Tamra D | $280,000 | |
| Previous Owner | Chavez Michael | $218,000 |
Source: Public Records
Tax History Compared to Growth
Tax History
| Year | Tax Paid | Tax Assessment Tax Assessment Total Assessment is a certain percentage of the fair market value that is determined by local assessors to be the total taxable value of land and additions on the property. | Land | Improvement |
|---|---|---|---|---|
| 2024 | $15,370 | $263,029 | $61,067 | $201,962 |
| 2023 | $14,281 | $243,230 | $56,470 | $186,760 |
| 2022 | $13,814 | $233,810 | $54,290 | $179,520 |
| 2021 | $13,475 | $228,000 | $52,940 | $175,060 |
| 2020 | $12,957 | $223,000 | $51,780 | $171,220 |
| 2019 | $12,690 | $212,020 | $49,230 | $162,790 |
| 2018 | $13,317 | $220,960 | $46,590 | $174,370 |
| 2017 | $13,034 | $210,560 | $44,400 | $166,160 |
| 2016 | $12,769 | $198,360 | $41,830 | $156,530 |
| 2015 | $12,655 | $184,800 | $38,970 | $145,830 |
| 2014 | $10,340 | $140,180 | $35,570 | $104,610 |
| 2013 | $10,227 | $142,150 | $36,070 | $106,080 |
Source: Public Records
Map
Nearby Homes
- 285 N Ridgeland Ave
- 156 S Sunnyside Ave
- 407 W North Ave
- 284 N Highland Ave
- 170 S Fairview Ave
- 355 W 1st St
- 322 N Highland Ave
- 196 N Walnut St
- 120 N Walnut St
- 17W517 Manor Ln
- 412 N Ridgeland Ave
- 508 W Alma St
- 204 E Hill St
- 255 S West Ave Unit 214
- 255 S West Ave Unit 413
- 104 Evergreen Ave
- 442 N Oak St
- 452 W Alma St
- 468 N Highland Ave
- 193 N Elm Ave
- 182 N Glenview Ave
- 184 N Glenview Ave
- 515 W 2nd St
- 549 W 2nd St
- 186 N Glenview Ave
- 513 W 2nd St
- 187 N Glenview Ave
- 551 W 2nd St
- 189 N Glenview Ave
- 190 N Glenview Ave
- 191 N Glade Ave
- 511 W 2nd St
- 555 W 2nd St
- 196 Glenview Ave
- 193 N Glade Ave
- 193 N Glenview Ave
- 509 W 2nd St
- 199 N Glade Ave
- 198 N Glenview Ave
- 197 N Glenview Ave