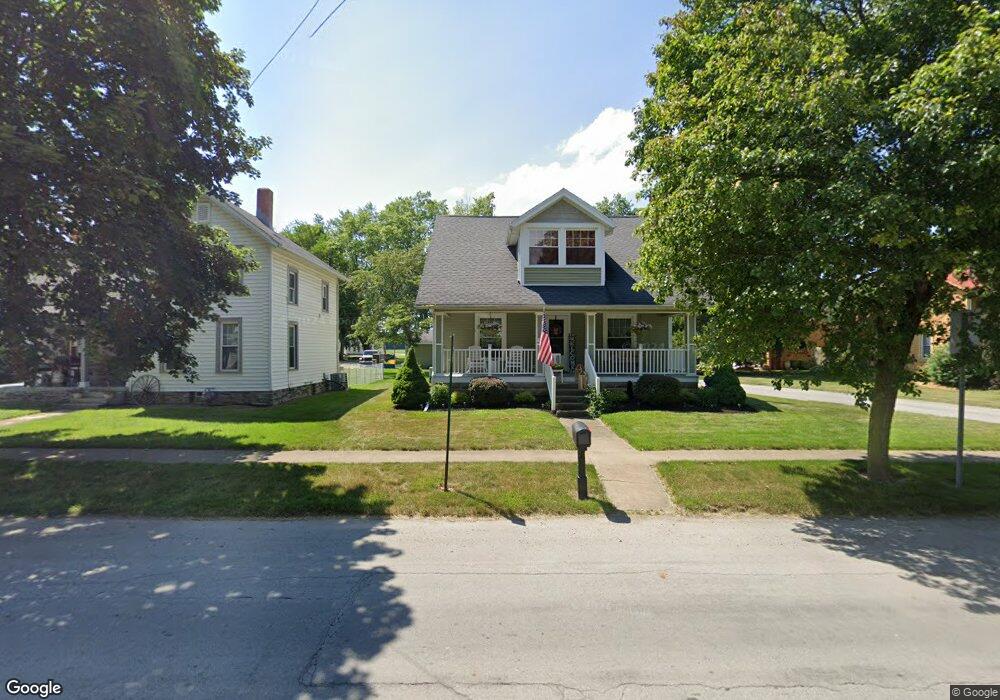
180 N Main St Creston, OH 44217
Estimated Value: $194,000 - $219,000
4
Beds
2
Baths
1,260
Sq Ft
$166/Sq Ft
Est. Value
About This Home
This home is located at 180 N Main St, Creston, OH 44217 and is currently estimated at $209,472, approximately $166 per square foot. 180 N Main St is a home located in Wayne County with nearby schools including Norwayne Elementary School, Norwayne Middle School, and Norwayne High School.
Ownership History
Date
Name
Owned For
Owner Type
Purchase Details
Closed on
Jun 15, 2022
Sold by
Hanzie Douglas J and Hanzie Kelly J
Bought by
Harklau Bobbie Jo
Current Estimated Value
Home Financials for this Owner
Home Financials are based on the most recent Mortgage that was taken out on this home.
Original Mortgage
$174,646
Outstanding Balance
$166,176
Interest Rate
5.27%
Mortgage Type
New Conventional
Estimated Equity
$43,296
Purchase Details
Closed on
Apr 17, 2013
Sold by
Pittman Olen D and Pittman Erin M
Bought by
Hanzie Douglas W and Hanzie Kelly J
Purchase Details
Closed on
Nov 30, 2000
Sold by
Fleming Carolyn S
Bought by
Pittman Olen D Erin M
Home Financials for this Owner
Home Financials are based on the most recent Mortgage that was taken out on this home.
Original Mortgage
$93,000
Interest Rate
7.86%
Mortgage Type
New Conventional
Create a Home Valuation Report for This Property
The Home Valuation Report is an in-depth analysis detailing your home's value as well as a comparison with similar homes in the area
Home Values in the Area
Average Home Value in this Area
Purchase History
| Date | Buyer | Sale Price | Title Company |
|---|---|---|---|
| Harklau Bobbie Jo | $172,900 | Kropf Wagner Law Firm | |
| Hanzie Douglas W | $33,500 | None Available | |
| Pittman Olen D Erin M | $92,000 | -- |
Source: Public Records
Mortgage History
| Date | Status | Borrower | Loan Amount |
|---|---|---|---|
| Open | Harklau Bobbie Jo | $174,646 | |
| Previous Owner | Pittman Olen D Erin M | $93,000 |
Source: Public Records
Tax History Compared to Growth
Tax History
| Year | Tax Paid | Tax Assessment Tax Assessment Total Assessment is a certain percentage of the fair market value that is determined by local assessors to be the total taxable value of land and additions on the property. | Land | Improvement |
|---|---|---|---|---|
| 2024 | $2,620 | $59,660 | $8,120 | $51,540 |
| 2023 | $2,620 | $59,660 | $8,120 | $51,540 |
| 2022 | $2,497 | $49,280 | $6,200 | $43,080 |
| 2021 | $1,728 | $37,410 | $6,200 | $31,210 |
| 2020 | $1,740 | $37,410 | $6,200 | $31,210 |
| 2019 | $1,524 | $33,260 | $5,510 | $27,750 |
| 2018 | $1,532 | $33,260 | $5,510 | $27,750 |
| 2017 | $1,522 | $33,260 | $5,510 | $27,750 |
| 2016 | $1,372 | $30,740 | $5,510 | $25,230 |
| 2015 | $1,356 | $30,740 | $5,510 | $25,230 |
| 2014 | $1,368 | $30,740 | $5,510 | $25,230 |
| 2013 | $1,426 | $31,980 | $5,450 | $26,530 |
Source: Public Records
Map
Nearby Homes
- 10368 Wooster Pike
- 147 N Main St
- 00 Sterling St
- 137 Forest View Ct
- 153 S Main St
- 0 Burbank St
- 154 Garden St
- 124 Garden St
- 5913 Stuckey Rd
- 14599 Eby Rd
- 5062 Catawba Place Ln
- 5222 Greenwich Rd Unit 2
- 9372 Towpath Trail
- 9376 Daniels Rd
- 129 Center St
- 6049 Valley Quail Ct
- 5833 Greenwich Rd
- 9252 Woodland Blue Dr
- 2961 Kestrell Ln
- 9248 Woodland Blue Dr
- 180 S Main St
- 172 N Main St
- 10396 Wooster Pike
- 170 N Main St
- 0 Main Unit 3692613
- 10390 Wooster Pike
- 168 N Main St
- 173 N Main St
- 171 N Main St
- 10387 Wooster Pike
- 169 N Main St
- 10384 Wooster Pike
- 117 Maple Ave
- 121 Maple Ave
- 166 N Main St
- 166 N Main St
- 167 N Main St
- 115 Maple Ave
- 165 N Main St
- 10376 Wooster Pike