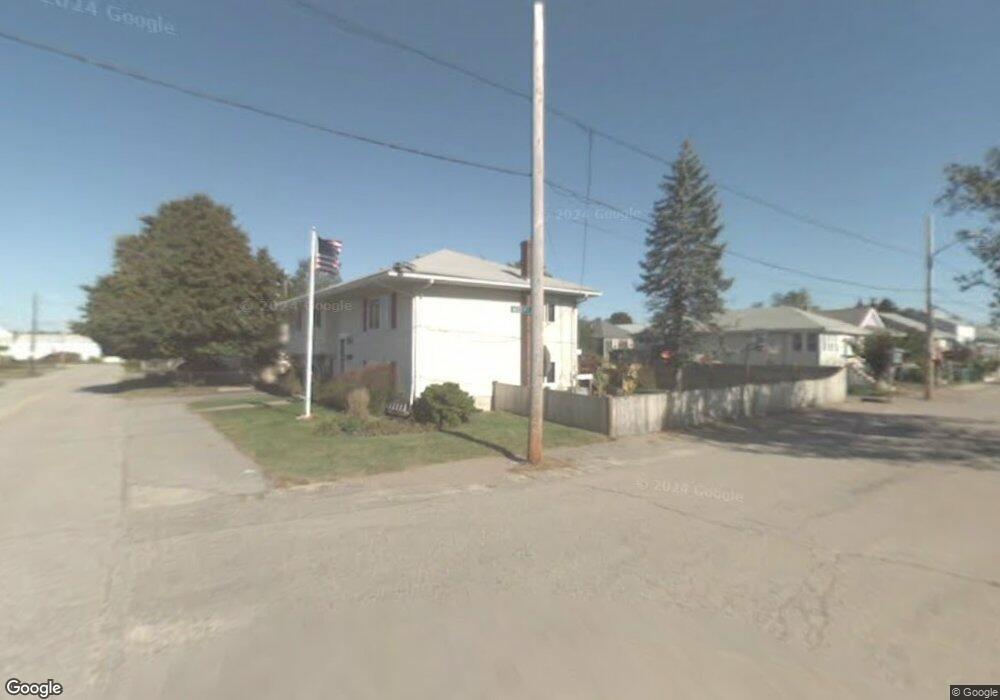
180 Newport Rd Hull, MA 02045
Whitehead NeighborhoodEstimated Value: $727,000 - $855,000
3
Beds
3
Baths
1,344
Sq Ft
$589/Sq Ft
Est. Value
About This Home
This home is located at 180 Newport Rd, Hull, MA 02045 and is currently estimated at $791,394, approximately $588 per square foot. 180 Newport Rd is a home located in Plymouth County with nearby schools including Lillian M. Jacobs Elementary School, Memorial Middle School, and Hull High School.
Ownership History
Date
Name
Owned For
Owner Type
Purchase Details
Closed on
Nov 1, 2018
Sold by
Johnson John R and Johnson Karen L
Bought by
Hagerty Gerard M and Hagerty Debra S
Current Estimated Value
Purchase Details
Closed on
Nov 20, 2001
Sold by
Walsh John W and Walsh Lorraine
Bought by
Johnson John R and Johnson Karen L
Home Financials for this Owner
Home Financials are based on the most recent Mortgage that was taken out on this home.
Original Mortgage
$257,000
Interest Rate
6.7%
Mortgage Type
Purchase Money Mortgage
Purchase Details
Closed on
Nov 19, 1999
Sold by
Mccaffery John M and Mccaffery Nancy I
Bought by
Walsh John W and Walsh Lorraine
Home Financials for this Owner
Home Financials are based on the most recent Mortgage that was taken out on this home.
Original Mortgage
$223,900
Interest Rate
7.76%
Mortgage Type
Purchase Money Mortgage
Purchase Details
Closed on
Sep 25, 1996
Sold by
Jones Maurice D
Bought by
Mccaffery John M and Mccaffery Nancy I
Purchase Details
Closed on
Nov 2, 1990
Sold by
Gentilucci Domenic V
Bought by
South Shore Holdings
Create a Home Valuation Report for This Property
The Home Valuation Report is an in-depth analysis detailing your home's value as well as a comparison with similar homes in the area
Home Values in the Area
Average Home Value in this Area
Purchase History
| Date | Buyer | Sale Price | Title Company |
|---|---|---|---|
| Hagerty Gerard M | $490,000 | -- | |
| Johnson John R | $380,000 | -- | |
| Walsh John W | $279,900 | -- | |
| Mccaffery John M | $160,000 | -- | |
| South Shore Holdings | $196,493 | -- |
Source: Public Records
Mortgage History
| Date | Status | Borrower | Loan Amount |
|---|---|---|---|
| Previous Owner | South Shore Holdings | $257,000 | |
| Previous Owner | South Shore Holdings | $30,000 | |
| Previous Owner | South Shore Holdings | $223,900 |
Source: Public Records
Tax History
| Year | Tax Paid | Tax Assessment Tax Assessment Total Assessment is a certain percentage of the fair market value that is determined by local assessors to be the total taxable value of land and additions on the property. | Land | Improvement |
|---|---|---|---|---|
| 2025 | $6,838 | $610,500 | $250,900 | $359,600 |
| 2024 | $6,864 | $589,200 | $243,500 | $345,700 |
| 2023 | $6,885 | $565,700 | $243,500 | $322,200 |
| 2022 | $6,713 | $535,300 | $243,500 | $291,800 |
| 2021 | $6,487 | $511,600 | $221,400 | $290,200 |
| 2020 | $5,879 | $458,600 | $214,000 | $244,600 |
| 2019 | $5,451 | $417,700 | $206,600 | $211,100 |
| 2018 | $5,544 | $413,100 | $206,600 | $206,500 |
| 2017 | $5,371 | $391,500 | $206,600 | $184,900 |
| 2016 | $5,352 | $397,000 | $221,400 | $175,600 |
| 2015 | $5,070 | $363,700 | $184,500 | $179,200 |
| 2014 | $4,892 | $352,700 | $184,500 | $168,200 |
Source: Public Records
Map
Nearby Homes
- 190 Newport Rd
- 168 Newport Rd
- 15 Bates St
- 164 Newport Rd
- 16 Bates St
- 19 Bates St
- 26 Kenberma St
- 30 Bates St
- 158 Newport Rd
- 158 Newport Rd Unit 1
- 19 Kenberma St
- 32 Bates St
- 158 Newport Rd-1st Fl- Waterfront Unit 1
- 30 Kenberma St
- 34 Bates St
- 206 Newport Rd
- 206 Newport Rd Unit 1
- 23 Kenberma St
- 33 Bates St
- 27 Kenberma St
Your Personal Tour Guide
Ask me questions while you tour the home.