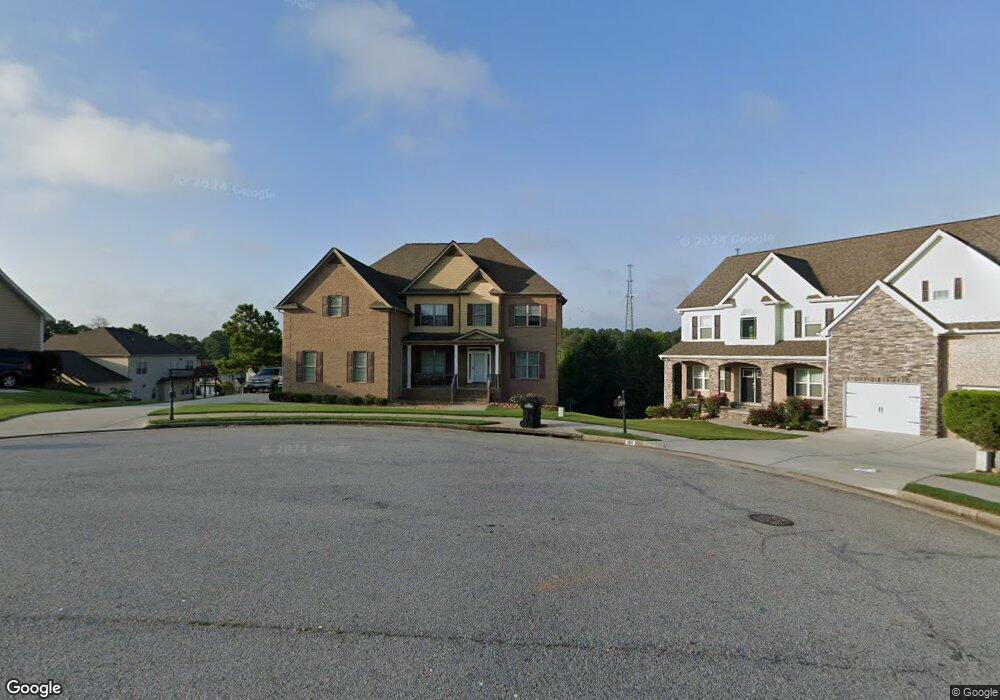
180 Opal Ct Unit 24 Fayetteville, GA 30215
Estimated Value: $505,000 - $623,000
5
Beds
4
Baths
3,800
Sq Ft
$148/Sq Ft
Est. Value
About This Home
This home is located at 180 Opal Ct Unit 24, Fayetteville, GA 30215 and is currently estimated at $561,192, approximately $147 per square foot. 180 Opal Ct Unit 24 is a home located in Fayette County with nearby schools including Spring Hill Elementary School, Bennett's Mill Middle School, and Fayette County High School.
Ownership History
Date
Name
Owned For
Owner Type
Purchase Details
Closed on
Jun 30, 2016
Bought by
Myers Lacoroin
Current Estimated Value
Home Financials for this Owner
Home Financials are based on the most recent Mortgage that was taken out on this home.
Original Mortgage
$245,217
Outstanding Balance
$196,260
Interest Rate
3.66%
Mortgage Type
FHA
Estimated Equity
$364,932
Purchase Details
Closed on
Mar 29, 2013
Sold by
First National Bank Of Gri
Bought by
Lewis Industries Holdings Llc
Home Financials for this Owner
Home Financials are based on the most recent Mortgage that was taken out on this home.
Original Mortgage
$22,450
Interest Rate
3.52%
Mortgage Type
New Conventional
Purchase Details
Closed on
Oct 7, 2008
Sold by
J & J Homes Inc
Bought by
First Natl Bk Of Griffin
Create a Home Valuation Report for This Property
The Home Valuation Report is an in-depth analysis detailing your home's value as well as a comparison with similar homes in the area
Home Values in the Area
Average Home Value in this Area
Purchase History
| Date | Buyer | Sale Price | Title Company |
|---|---|---|---|
| Myers Lacoroin | $250,000 | -- | |
| Lewis Industries Holdings Llc | $22,450 | -- | |
| First Natl Bk Of Griffin | $45,500 | -- |
Source: Public Records
Mortgage History
| Date | Status | Borrower | Loan Amount |
|---|---|---|---|
| Open | Myers Lacoroin | $245,217 | |
| Previous Owner | Lewis Industries Holdings Llc | $22,450 |
Source: Public Records
Tax History Compared to Growth
Tax History
| Year | Tax Paid | Tax Assessment Tax Assessment Total Assessment is a certain percentage of the fair market value that is determined by local assessors to be the total taxable value of land and additions on the property. | Land | Improvement |
|---|---|---|---|---|
| 2024 | $4,362 | $213,968 | $28,000 | $185,968 |
| 2023 | $3,863 | $204,920 | $28,000 | $176,920 |
| 2022 | $4,238 | $197,560 | $28,000 | $169,560 |
| 2021 | $3,843 | $163,080 | $22,000 | $141,080 |
| 2020 | $4,681 | $153,440 | $22,000 | $131,440 |
| 2019 | $4,592 | $149,120 | $22,000 | $127,120 |
| 2018 | $4,246 | $136,600 | $20,800 | $115,800 |
| 2017 | $2,924 | $99,964 | $15,124 | $84,840 |
| 2016 | $3,745 | $122,560 | $20,800 | $101,760 |
| 2015 | $3,771 | $121,200 | $20,800 | $100,400 |
| 2014 | $2,691 | $84,900 | $8,980 | $75,920 |
| 2013 | -- | $15,600 | $0 | $0 |
Source: Public Records
Map
Nearby Homes
- 135 Knights Ct
- 130 Thrushwood Dr
- 0 Dixon Extension
- 500 Dickson Springs Rd
- 175 Annelle Park Dr
- The Mildred Plan at Mitchell Estates
- The Bradford Plan at Mitchell Estates
- 115 Linda Way
- 230 Wyngate Cir
- 235 Woodstream Way
- 865 Virginia Highlands
- 210 Pecan Ridge Dr Unit 2
- NONE OR ZERO S Jeff Davis Dr
- 205 Wyngate Cir
- 170 Woodstream Way Unit B
- 175 Keaton Dr
- 180 Woodgate Dr
- 415 Williamsburg Way
- 140 Waldrop Way
- 865 S Jeff Davis Dr
- 180 Opal Ct
- 190 Opal Ct Unit 23
- 150 Opal Ct
- 110 Opal Ct
- 110 Opal Ct Unit 26
- 145 Elenor Dr
- 135 Elenor Dr
- 155 Elenor Dr
- 130 Elenor Dr
- 175 Opal Ct
- 165 Opal Ct
- 0 Opal Ct Unit 8712017
- 0 Opal Ct Unit 8640914
- 0 Opal Ct Unit 8630953
- 0 Opal Ct Unit 8460271
- 0 Opal Ct Unit 8306392
- 0 Opal Ct Unit 8234161
- 0 Opal Ct Unit 7085401
- 0 Opal Ct Unit 7197755
- 125 Elenor Dr