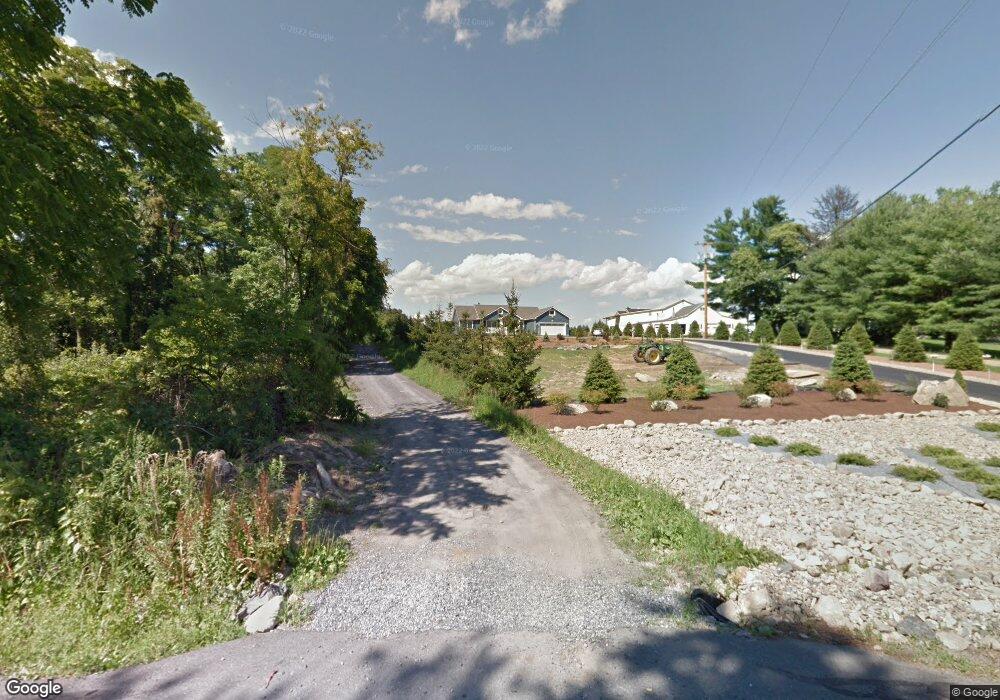
180 Perkinsville Rd Highland, NY 12528
Lloyd NeighborhoodEstimated Value: $458,000 - $588,000
3
Beds
2
Baths
1,617
Sq Ft
$325/Sq Ft
Est. Value
About This Home
This home is located at 180 Perkinsville Rd, Highland, NY 12528 and is currently estimated at $525,907, approximately $325 per square foot. 180 Perkinsville Rd is a home with nearby schools including Highland Elementary School, Highland Middle School, and Highland High School.
Ownership History
Date
Name
Owned For
Owner Type
Purchase Details
Closed on
May 17, 2024
Sold by
Winer Barry M
Bought by
Lamela John F and Lamela Meredith J
Current Estimated Value
Home Financials for this Owner
Home Financials are based on the most recent Mortgage that was taken out on this home.
Original Mortgage
$472,500
Interest Rate
6.25%
Mortgage Type
Purchase Money Mortgage
Purchase Details
Closed on
Nov 6, 2019
Sold by
Winer Ronald M
Bought by
Winer Barry M and Winer Ronald M
Purchase Details
Closed on
Mar 6, 2013
Sold by
Winer Ronald M and Winer Sydel H
Bought by
Winer Ronald M
Purchase Details
Closed on
Jun 24, 2011
Sold by
Valentino Joseph F and Valentino Jean M
Bought by
Winer Ronald M and Winer Sydel H
Create a Home Valuation Report for This Property
The Home Valuation Report is an in-depth analysis detailing your home's value as well as a comparison with similar homes in the area
Home Values in the Area
Average Home Value in this Area
Purchase History
| Date | Buyer | Sale Price | Title Company |
|---|---|---|---|
| Lamela John F | $525,000 | None Available | |
| Lamela John F | $525,000 | None Available | |
| Lamela John F | $525,000 | None Available | |
| Winer Barry M | -- | None Available | |
| Winer Barry M | -- | None Available | |
| Winer Barry M | -- | None Available | |
| Winer Ronald M | -- | -- | |
| Winer Ronald M | -- | -- | |
| Winer Ronald M | $65,000 | None Available | |
| Winer Ronald M | $65,000 | None Available | |
| Winer Ronald M | $65,000 | None Available |
Source: Public Records
Mortgage History
| Date | Status | Borrower | Loan Amount |
|---|---|---|---|
| Previous Owner | Lamela John F | $472,500 |
Source: Public Records
Tax History Compared to Growth
Tax History
| Year | Tax Paid | Tax Assessment Tax Assessment Total Assessment is a certain percentage of the fair market value that is determined by local assessors to be the total taxable value of land and additions on the property. | Land | Improvement |
|---|---|---|---|---|
| 2024 | $9,717 | $265,976 | $94,300 | $171,676 |
| 2023 | $9,553 | $265,976 | $94,300 | $171,676 |
| 2022 | $9,286 | $265,976 | $94,300 | $171,676 |
| 2021 | $9,286 | $265,976 | $94,300 | $171,676 |
| 2020 | $9,956 | $304,000 | $94,300 | $209,700 |
| 2019 | $9,742 | $312,500 | $94,300 | $218,200 |
| 2018 | $10,230 | $312,500 | $94,300 | $218,200 |
| 2017 | $9,958 | $312,500 | $94,300 | $218,200 |
| 2016 | $9,744 | $312,500 | $94,300 | $218,200 |
| 2015 | -- | $312,500 | $94,300 | $218,200 |
| 2014 | -- | $312,500 | $94,300 | $218,200 |
Source: Public Records
Map
Nearby Homes
- 3748 Us Highway 9w
- 57 Mayer Dr
- 269 Orchard Rd
- 340 Vineyard Ave
- 30 Mayer Dr
- 61 Peach Ln
- 307 Vineyard Ave
- 24 New Rd
- 10-32 S Roberts Rd
- 243 Vineyard Ave Unit 251
- 222 Sterling Place
- 224 Vineyard Ave
- 29 Oakes Rd
- 114 Hudson Pointe Dr
- 8 Bills Ln
- 32 Hurlihe St Unit C
- 303 Bridgeview Dr
- 37 Hudson Heights Dr
- 28 Hudson Heights Dr
- 164 Rinaldi Blvd Unit B
- 188 Perkinsville Rd
- 178 Perkinsville Rd
- 182 Perkinsville Rd
- 0 Perkinsville Rd
- 205 Perkinsville Rd
- 203 Perkinsville Rd
- 1 Wellington Place
- 232 Perkinsville Rd
- 207 Perkinsville Rd
- 5 Wellington Place
- 231 Perkinsville Rd
- 234 Perkinsville Rd
- 221 Perkinsville Rd
- 2 Wellington Place
- 175 Perkinsville Rd
- 223 Perkinsville Rd
- 235 Perkinsville Rd
- 238 Perkinsville Rd
- 173 Perkinsville Rd
- 4 Wellington Place