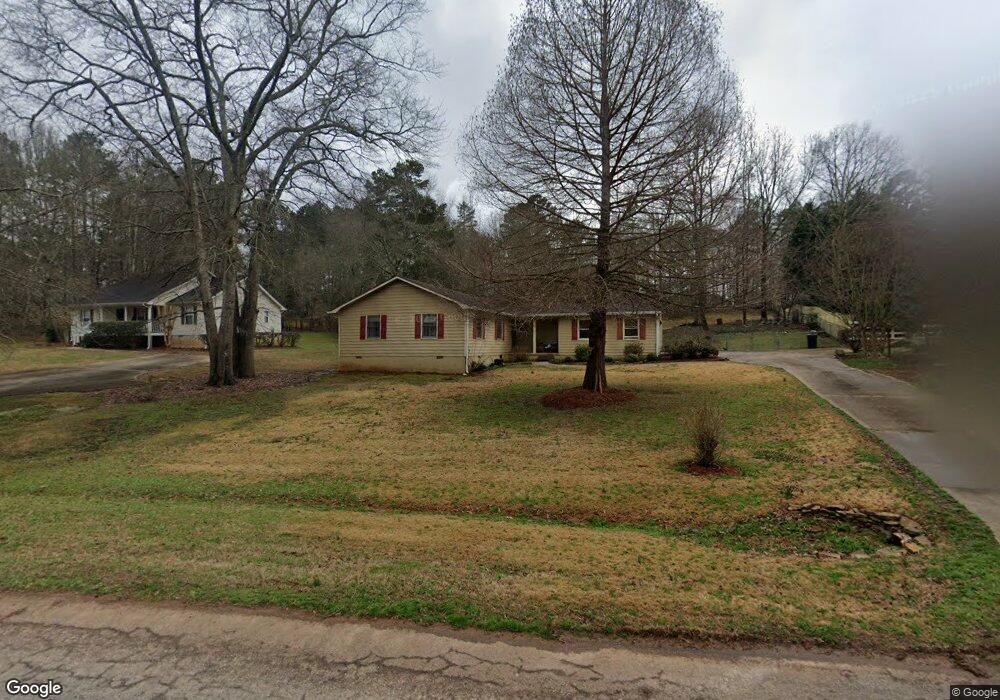
180 Pinenut Ln Bogart, GA 30622
Estimated Value: $228,672 - $339,000
--
Bed
--
Bath
1,419
Sq Ft
$209/Sq Ft
Est. Value
About This Home
This home is located at 180 Pinenut Ln, Bogart, GA 30622 and is currently estimated at $296,418, approximately $208 per square foot. 180 Pinenut Ln is a home located in Clarke County with nearby schools including Cleveland Road Elementary School, Burney-Harris-Lyons Middle School, and Clarke Central High School.
Ownership History
Date
Name
Owned For
Owner Type
Purchase Details
Closed on
Feb 4, 2020
Sold by
Glines Robert L Estate
Bought by
Glines Elaine H and Glines Christopher D
Current Estimated Value
Home Financials for this Owner
Home Financials are based on the most recent Mortgage that was taken out on this home.
Original Mortgage
$140,000
Outstanding Balance
$123,960
Interest Rate
3.6%
Mortgage Type
New Conventional
Estimated Equity
$172,458
Purchase Details
Closed on
Jan 13, 2020
Sold by
Glines Christopher D
Bought by
Glines Elaine H
Home Financials for this Owner
Home Financials are based on the most recent Mortgage that was taken out on this home.
Original Mortgage
$140,000
Outstanding Balance
$123,960
Interest Rate
3.6%
Mortgage Type
New Conventional
Estimated Equity
$172,458
Purchase Details
Closed on
Aug 17, 1990
Sold by
Nutt Richard L
Bought by
Glines Robert L and Glines Elaine H
Create a Home Valuation Report for This Property
The Home Valuation Report is an in-depth analysis detailing your home's value as well as a comparison with similar homes in the area
Home Values in the Area
Average Home Value in this Area
Purchase History
| Date | Buyer | Sale Price | Title Company |
|---|---|---|---|
| Glines Elaine H | -- | -- | |
| Glines Elaine H | -- | -- | |
| Glines Robert L | $10,500 | -- |
Source: Public Records
Mortgage History
| Date | Status | Borrower | Loan Amount |
|---|---|---|---|
| Open | Glines Elaine H | $140,000 |
Source: Public Records
Tax History Compared to Growth
Tax History
| Year | Tax Paid | Tax Assessment Tax Assessment Total Assessment is a certain percentage of the fair market value that is determined by local assessors to be the total taxable value of land and additions on the property. | Land | Improvement |
|---|---|---|---|---|
| 2024 | $1,549 | $94,005 | $12,000 | $82,005 |
| 2023 | $389 | $88,046 | $12,000 | $76,046 |
| 2022 | $1,559 | $75,272 | $10,400 | $64,872 |
| 2021 | $2,142 | $63,570 | $10,400 | $53,170 |
| 2020 | $1,474 | $62,945 | $10,400 | $52,545 |
| 2019 | $1,353 | $53,340 | $10,400 | $42,940 |
| 2018 | $1,317 | $50,719 | $10,400 | $40,319 |
| 2017 | $1,314 | $50,541 | $10,400 | $40,141 |
| 2016 | $1,279 | $48,024 | $10,400 | $37,624 |
| 2015 | $1,242 | $46,573 | $10,400 | $36,173 |
| 2014 | $1,256 | $47,009 | $10,400 | $36,609 |
Source: Public Records
Map
Nearby Homes
- 350 Huff Lake Rd
- 145 S Arcadia Dr
- 105 S Arcadia Dr
- 119 S Church St
- 179 St Thomas Place
- 0 S Burson Ave Unit 1021231
- 0 S Burson Ave Unit 10370338
- 140 Ingobert Place
- 105 Tall Tree Rd
- 210 Tall Tree Rd
- 150 Buttercup Ln
- 1846 Savage Rd
- 1050 Aiken Rd
- 2157 Day Dr
- 2188 Day Dr
- 1920 Atlanta Hwy
- 537 Greenlee Rd
- 1851 McNutt Creek Rd
- 188 Pinenut Ln
- 172 Pinenut Ln
- 196 Pinenut Ln
- 177 Pinenut Ln
- 151 Pheasant Run
- 155 Pheasant Run
- 185 Pinenut Ln
- 164 Pinenut Ln
- 161 Pheasant Run
- 145 Pheasant Run
- 169 Pinenut Ln
- 193 Pinenut Ln
- 195 Hidden Cove Dr
- 180 Hidden Cove Dr
- 163 Pheasant Run
- 156 Pinenut Ln
- 161 Pinenut Ln
- 139 Pheasant Run
- 146 Pheasant Run
- 150 Pheasant Run