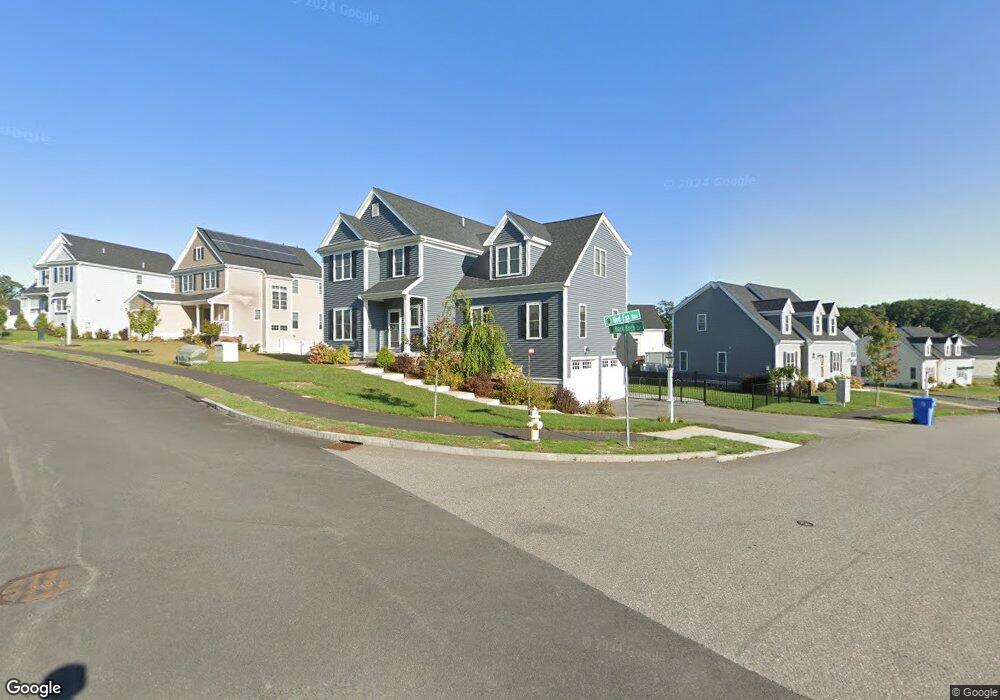
180 Red Fox Run Wrentham, MA 02093
Estimated Value: $822,482 - $1,114,000
3
Beds
3
Baths
2,670
Sq Ft
$355/Sq Ft
Est. Value
About This Home
This home is located at 180 Red Fox Run, Wrentham, MA 02093 and is currently estimated at $949,121, approximately $355 per square foot. 180 Red Fox Run is a home with nearby schools including Delaney Elementary School and Charles E Roderick.
Ownership History
Date
Name
Owned For
Owner Type
Purchase Details
Closed on
Mar 13, 2023
Sold by
Mcgowan Scott F and Mcgowan Tracy
Bought by
Mcgowan Ft
Current Estimated Value
Purchase Details
Closed on
Nov 2, 2015
Sold by
Eaglebrook Development
Bought by
Mcgowan Scott F and Mcgowan Tracy
Home Financials for this Owner
Home Financials are based on the most recent Mortgage that was taken out on this home.
Original Mortgage
$410,000
Interest Rate
3.92%
Mortgage Type
New Conventional
Create a Home Valuation Report for This Property
The Home Valuation Report is an in-depth analysis detailing your home's value as well as a comparison with similar homes in the area
Purchase History
| Date | Buyer | Sale Price | Title Company |
|---|---|---|---|
| Mcgowan Ft | -- | None Available | |
| Mcgowan Scott F | $457,900 | -- |
Source: Public Records
Mortgage History
| Date | Status | Borrower | Loan Amount |
|---|---|---|---|
| Previous Owner | Mcgowan Scott F | $410,000 |
Source: Public Records
Tax History
| Year | Tax Paid | Tax Assessment Tax Assessment Total Assessment is a certain percentage of the fair market value that is determined by local assessors to be the total taxable value of land and additions on the property. | Land | Improvement |
|---|---|---|---|---|
| 2025 | $9,302 | $802,600 | $221,400 | $581,200 |
| 2024 | $8,764 | $730,300 | $221,400 | $508,900 |
| 2023 | $8,642 | $684,800 | $201,300 | $483,500 |
| 2022 | $8,350 | $610,800 | $195,800 | $415,000 |
| 2021 | $7,938 | $564,200 | $183,000 | $381,200 |
| 2020 | $7,833 | $549,700 | $139,700 | $410,000 |
| 2019 | $7,364 | $521,500 | $139,700 | $381,800 |
| 2018 | $6,839 | $480,300 | $140,200 | $340,100 |
| 2017 | $6,495 | $455,800 | $123,700 | $332,100 |
| 2016 | $428 | $30,000 | $30,000 | $0 |
| 2015 | $481 | $32,100 | $32,100 | $0 |
| 2014 | $473 | $30,900 | $30,900 | $0 |
Source: Public Records
Map
Nearby Homes
- 50 Reed Fulton Ave Unit Lot 61
- 287 Park St
- 500 Franklin St
- 75 Jordan Rd
- 9 Elliot Mills Unit 5
- 8 Elliot Mills Unit 30
- 5 Elliot Mills Unit 3
- 7 Elliot Mills Unit 4
- 10 Elliot Mills Unit 29
- 45 Joshua Rd
- 14 Waites Crossing
- 20 Waites Crossing
- 19 Waites Crossing
- 13 Waites Crossing
- 246 Forest Grove Ave
- 62 Uncas Ave
- 64 Uncas Ave
- 30 Longobardi Dr Unit 30
- 66 Uncas Ave
- 68 Uncas Ave
- 150 Black Birch Dr
- 174 Red Fox Run
- 165 Red Fox Run
- 15 Pheasant Run Ct Unit 53
- 155 Black Birch Dr
- 160 Black Birch Dr
- 155 Red Fox Run
- 135 Black Birch Dr
- 145 Black Birch Dr
- 25 Pheasant Run Ct
- 165 Black Birch Dr
- 130 Black Birch Dr
- 145 Red Fox Run
- 175 Black Birch Dr
- 172 Red Fox Run
- 170 Black Birch Dr
- 35 Pheasant Run Ct
- 0 Pheasant Run Ct Unit 64
- 120 Black Birch Dr
- 135 Red Fox Run
Your Personal Tour Guide
Ask me questions while you tour the home.