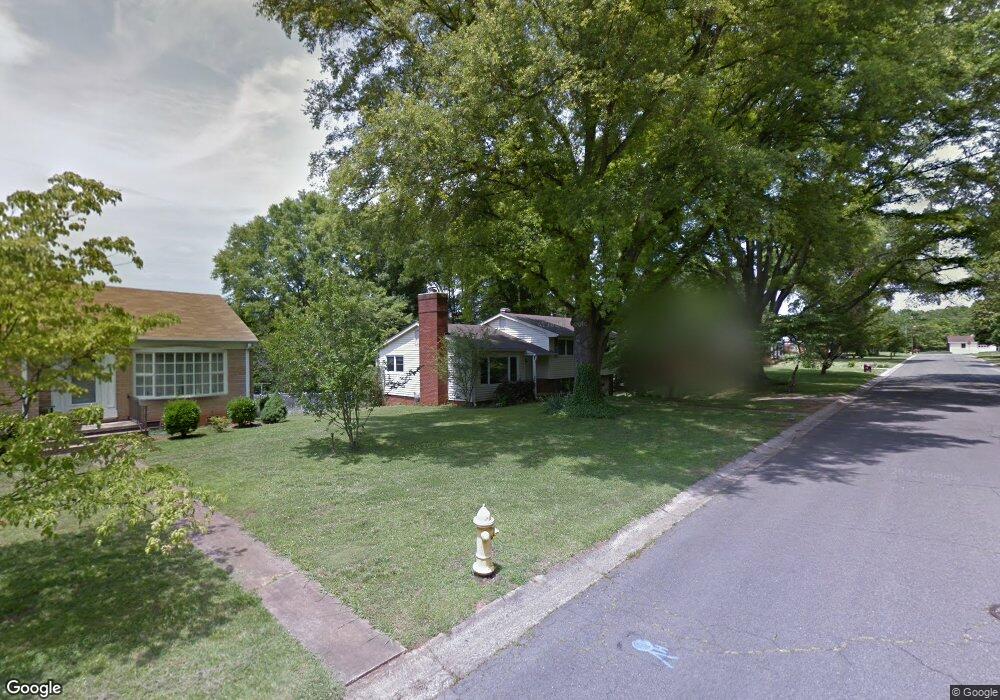
180 Rutledge Ave SW Concord, NC 28025
Estimated Value: $289,000 - $330,000
3
Beds
2
Baths
1,770
Sq Ft
$174/Sq Ft
Est. Value
About This Home
This home is located at 180 Rutledge Ave SW, Concord, NC 28025 and is currently estimated at $308,459, approximately $174 per square foot. 180 Rutledge Ave SW is a home located in Cabarrus County with nearby schools including R Brown Mcallister STEMElementary, Concord Middle School, and Concord High School.
Ownership History
Date
Name
Owned For
Owner Type
Purchase Details
Closed on
Feb 3, 2025
Sold by
Carolina Car Wash Llc
Bought by
Majak Properties Llc
Current Estimated Value
Purchase Details
Closed on
Apr 7, 2015
Sold by
Johnson John Patrick and Dietrick Melissa Ann
Bought by
Carolina Car Wash Llc
Purchase Details
Closed on
Jul 31, 2009
Sold by
Best Susan L
Bought by
Johnson John Patrick
Home Financials for this Owner
Home Financials are based on the most recent Mortgage that was taken out on this home.
Original Mortgage
$132,554
Interest Rate
5.37%
Mortgage Type
FHA
Purchase Details
Closed on
Aug 19, 2004
Sold by
Strickland Ernest L and Strickland Christine M
Bought by
Best Susan L
Home Financials for this Owner
Home Financials are based on the most recent Mortgage that was taken out on this home.
Original Mortgage
$87,920
Interest Rate
5.91%
Mortgage Type
Purchase Money Mortgage
Create a Home Valuation Report for This Property
The Home Valuation Report is an in-depth analysis detailing your home's value as well as a comparison with similar homes in the area
Home Values in the Area
Average Home Value in this Area
Purchase History
| Date | Buyer | Sale Price | Title Company |
|---|---|---|---|
| Majak Properties Llc | -- | None Listed On Document | |
| Majak Properties Llc | -- | None Listed On Document | |
| Carolina Car Wash Llc | $84,525 | None Available | |
| Johnson John Patrick | $135,000 | None Available | |
| Best Susan L | $110,000 | -- |
Source: Public Records
Mortgage History
| Date | Status | Borrower | Loan Amount |
|---|---|---|---|
| Previous Owner | Johnson John Patrick | $132,554 | |
| Previous Owner | Best Susan L | $87,920 |
Source: Public Records
Tax History Compared to Growth
Tax History
| Year | Tax Paid | Tax Assessment Tax Assessment Total Assessment is a certain percentage of the fair market value that is determined by local assessors to be the total taxable value of land and additions on the property. | Land | Improvement |
|---|---|---|---|---|
| 2025 | $2,516 | $252,620 | $80,000 | $172,620 |
| 2024 | $2,516 | $252,620 | $80,000 | $172,620 |
| 2023 | $1,714 | $140,520 | $37,000 | $103,520 |
| 2022 | $1,678 | $137,520 | $37,000 | $100,520 |
| 2021 | $1,678 | $137,520 | $37,000 | $100,520 |
| 2020 | $1,678 | $137,520 | $37,000 | $100,520 |
| 2019 | $1,391 | $114,030 | $32,000 | $82,030 |
| 2018 | $1,368 | $114,030 | $32,000 | $82,030 |
| 2017 | $1,346 | $114,030 | $32,000 | $82,030 |
| 2016 | $798 | $109,720 | $32,000 | $77,720 |
| 2015 | $1,295 | $109,720 | $32,000 | $77,720 |
| 2014 | $1,295 | $109,720 | $32,000 | $77,720 |
Source: Public Records
Map
Nearby Homes
- 671 Sedgefield St SW
- 159 Fryling Ave SW
- 80 Pounds Ave SW
- 736 Spring St SW
- 309 Brightwood Ct SW
- 269 Fryling Ave SW
- 782 Union St S
- 783 Union St S
- 569 Union St S
- 571 Union St S
- 111 Wilshire Ave SW
- 24 Doris Ct SE
- 23 Lawndale Ave SE
- 34 Rollingwood Dr SE
- 00 Rollingwood Ln
- 66 Arlington Ave SE
- 60 Patton Ct SE
- 85 Myrtle Ave SW
- 745 Carolyn Dr SE
- 113 Arlington Ave SE
- 172 Rutledge Ave SW
- 190 Rutledge Ave SW
- 200 Obrien Place SW
- 199 Obrien Place SW
- 164 Rutledge Ave SW
- 179 Rutledge Ave SW
- 198 Rutledge Ave SW
- 196 Obrien Place SW
- 173 Rutledge Ave SW
- 189 Rutledge Ave SW
- 195 Obrien Place SW
- 226 Morgan Place SW
- 192 Obrien Place SW
- 165 Rutledge Ave SW
- 165 Rutledge Ave SW Unit 21
- 197 Rutledge Ave SW
- 154 Rutledge Ave SW
- 206 Rutledge Ave SW
- 230 Morgan Place SW
- 191 Obrien Place SW