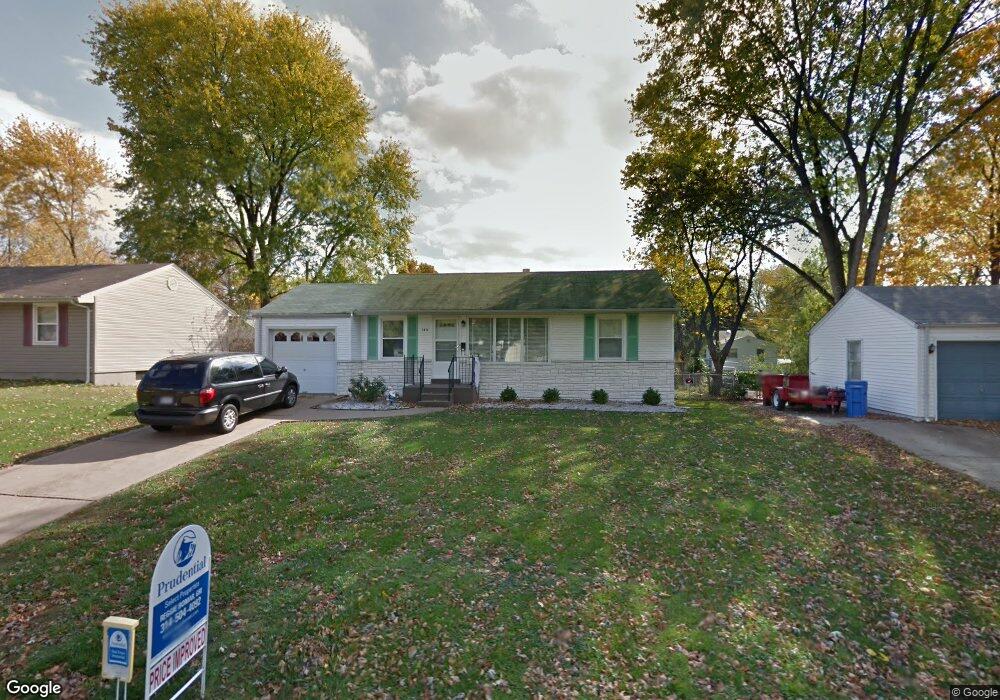
180 Saint Nicholas Ln Florissant, MO 63031
Estimated Value: $134,684 - $162,000
3
Beds
1
Bath
864
Sq Ft
$172/Sq Ft
Est. Value
About This Home
This home is located at 180 Saint Nicholas Ln, Florissant, MO 63031 and is currently estimated at $148,921, approximately $172 per square foot. 180 Saint Nicholas Ln is a home located in St. Louis County with nearby schools including Duchesne Elementary School, Cross Keys Middle School, and McCluer North High School.
Ownership History
Date
Name
Owned For
Owner Type
Purchase Details
Closed on
Jun 10, 2020
Sold by
Jones Nathan A and Jones Jameala
Bought by
Jones Nathan A and Jones Jameala
Current Estimated Value
Home Financials for this Owner
Home Financials are based on the most recent Mortgage that was taken out on this home.
Original Mortgage
$62,950
Outstanding Balance
$55,695
Interest Rate
3.1%
Mortgage Type
New Conventional
Estimated Equity
$93,226
Purchase Details
Closed on
Oct 3, 2013
Sold by
Krauss Judith A
Bought by
Jones Nathan A
Purchase Details
Closed on
May 11, 2011
Sold by
Funk Gerald J
Bought by
Krauss Judith A
Purchase Details
Closed on
Jan 3, 2008
Sold by
Funk Claire H and Funk Gerald J
Bought by
Funk Gerald J and Funk Family Trust
Purchase Details
Closed on
Oct 1, 1999
Sold by
Funk Claire H
Bought by
Funk Gerald J and Krauss Judith
Create a Home Valuation Report for This Property
The Home Valuation Report is an in-depth analysis detailing your home's value as well as a comparison with similar homes in the area
Home Values in the Area
Average Home Value in this Area
Purchase History
| Date | Buyer | Sale Price | Title Company |
|---|---|---|---|
| Jones Nathan A | -- | Freedom Title Llc St Louis | |
| Jones Nathan A | $68,000 | Investors Title Co Clayton | |
| Krauss Judith A | -- | None Available | |
| Funk Gerald J | -- | None Available | |
| Funk Gerald J | -- | -- |
Source: Public Records
Mortgage History
| Date | Status | Borrower | Loan Amount |
|---|---|---|---|
| Open | Jones Nathan A | $62,950 |
Source: Public Records
Tax History Compared to Growth
Tax History
| Year | Tax Paid | Tax Assessment Tax Assessment Total Assessment is a certain percentage of the fair market value that is determined by local assessors to be the total taxable value of land and additions on the property. | Land | Improvement |
|---|---|---|---|---|
| 2025 | $1,631 | $24,060 | $4,640 | $19,420 |
| 2024 | $1,631 | $20,880 | $2,770 | $18,110 |
| 2023 | $1,626 | $20,880 | $2,770 | $18,110 |
| 2022 | $1,496 | $16,870 | $3,550 | $13,320 |
| 2021 | $1,471 | $16,870 | $3,550 | $13,320 |
| 2020 | $1,443 | $15,630 | $3,550 | $12,080 |
| 2019 | $1,415 | $15,630 | $3,550 | $12,080 |
| 2018 | $1,236 | $12,160 | $2,050 | $10,110 |
| 2017 | $1,229 | $12,160 | $2,050 | $10,110 |
| 2016 | $1,260 | $12,160 | $2,810 | $9,350 |
| 2015 | $1,268 | $12,160 | $2,810 | $9,350 |
| 2014 | $1,283 | $12,710 | $3,250 | $9,460 |
Source: Public Records
Map
Nearby Homes
- 215 Derhake Rd
- 150 Saint Daniel Ln
- 1205 Saint Matthew Dr
- 38 Spring Dr
- 24 Valley Dr
- 14 Saint Martha Ct
- 270 W Saint Anthony Ln
- 250 Maple Dr
- 215 Maple Dr
- 4000 Washington St
- 785 Bobbins Ln
- 805 Derhake Rd
- 2320 Allen Dr
- 165 Maple Dr
- 2240 Brook Dr
- 105 Capri Dr
- 505 Ridge Dr
- 629 Aubuchon St
- 940 Harrison St
- 1290 Saint Louis St
- 170 Saint Nicholas Ln
- 190 Saint Nicholas Ln
- 155 Derhake Rd
- 165 Derhake Rd
- 200 Saint Nicholas Ln
- 160 Saint Nicholas Ln
- 145 Derhake Rd
- 175 Derhake Rd
- 185 Saint Nicholas Ln
- 175 Saint Nicholas Ln
- 135 Derhake Rd
- 195 Saint Nicholas Ln
- 185 Derhake Rd
- 165 Saint Nicholas Ln
- 150 Saint Nicholas Ln
- 210 Saint Nicholas Ln
- 125 Derhake Rd
- 205 Saint Nicholas Ln
- 195 Derhake Rd
- 155 Saint Nicholas Ln