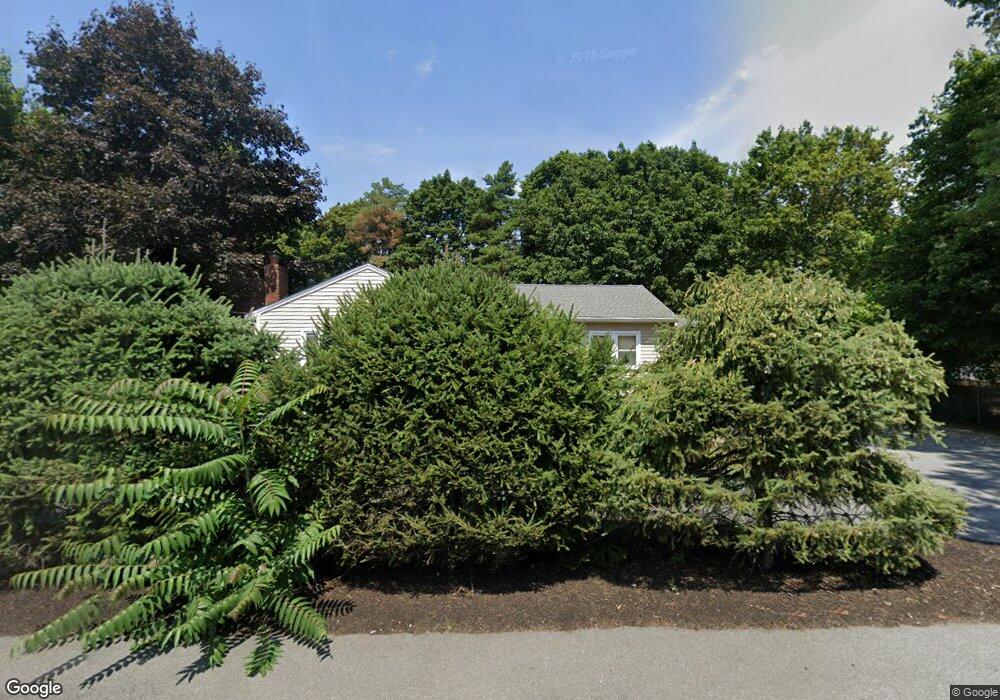
180 Salem St Lynnfield, MA 01940
Estimated Value: $615,000 - $866,000
3
Beds
1
Bath
1,153
Sq Ft
$651/Sq Ft
Est. Value
About This Home
This home is located at 180 Salem St, Lynnfield, MA 01940 and is currently estimated at $750,379, approximately $650 per square foot. 180 Salem St is a home located in Essex County with nearby schools including Lynnfield Middle School, Pickering Middle School, and Lynnfield High School.
Ownership History
Date
Name
Owned For
Owner Type
Purchase Details
Closed on
Mar 14, 1994
Sold by
Tracy Rt and Olivolo Charels
Bought by
Lynch David A and Jones Amybeth
Current Estimated Value
Purchase Details
Closed on
Sep 18, 1992
Sold by
Federal Home Loan Mortgage Corporation
Bought by
Olivolo Charles T and Olivolo Charles C
Purchase Details
Closed on
May 13, 1992
Sold by
Husson Phyllis J
Bought by
Fhlmc
Create a Home Valuation Report for This Property
The Home Valuation Report is an in-depth analysis detailing your home's value as well as a comparison with similar homes in the area
Home Values in the Area
Average Home Value in this Area
Purchase History
| Date | Buyer | Sale Price | Title Company |
|---|---|---|---|
| Lynch David A | $155,000 | -- | |
| Olivolo Charles T | $130,000 | -- | |
| Fhlmc | $130,000 | -- |
Source: Public Records
Mortgage History
| Date | Status | Borrower | Loan Amount |
|---|---|---|---|
| Open | Fhlmc | $116,125 | |
| Closed | Fhlmc | $128,000 | |
| Closed | Fhlmc | $128,500 |
Source: Public Records
Tax History Compared to Growth
Tax History
| Year | Tax Paid | Tax Assessment Tax Assessment Total Assessment is a certain percentage of the fair market value that is determined by local assessors to be the total taxable value of land and additions on the property. | Land | Improvement |
|---|---|---|---|---|
| 2025 | $6,084 | $576,100 | $425,600 | $150,500 |
| 2024 | $5,767 | $548,700 | $405,300 | $143,400 |
| 2023 | $5,296 | $468,700 | $336,400 | $132,300 |
| 2022 | $5,014 | $418,200 | $304,400 | $113,800 |
| 2021 | $5,175 | $390,000 | $281,900 | $108,100 |
| 2020 | $5,046 | $362,500 | $254,400 | $108,100 |
| 2019 | $4,690 | $337,200 | $229,100 | $108,100 |
| 2018 | $4,561 | $331,500 | $229,100 | $102,400 |
| 2017 | $4,281 | $310,700 | $208,300 | $102,400 |
| 2016 | $4,407 | $303,900 | $208,300 | $95,600 |
| 2015 | $4,011 | $276,800 | $185,800 | $91,000 |
Source: Public Records
Map
Nearby Homes