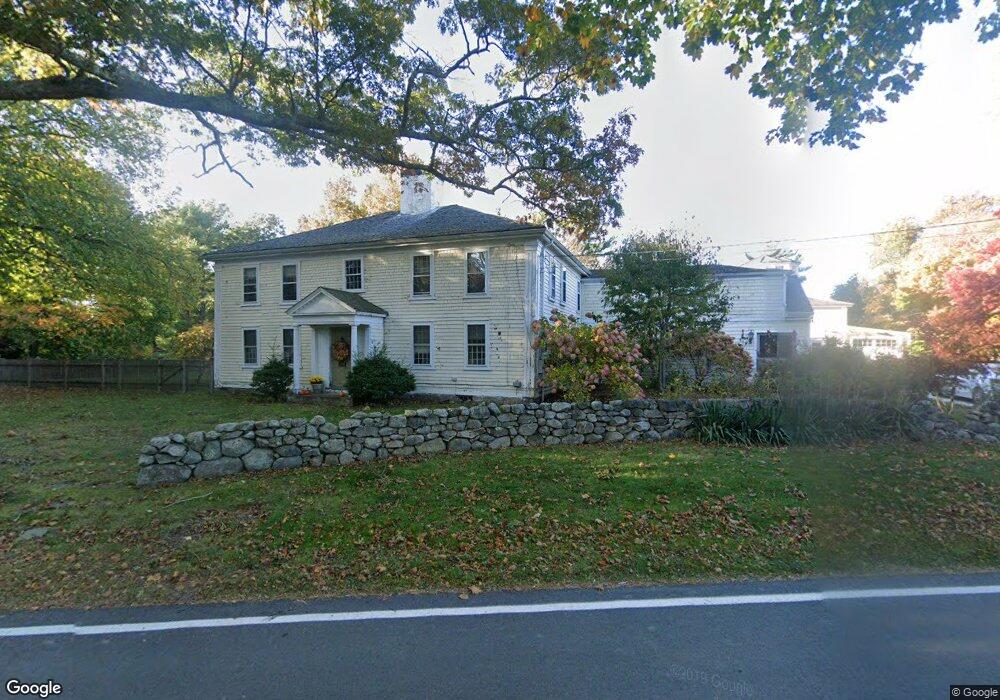
180 Spring St Marshfield, MA 02050
Estimated Value: $1,136,000 - $1,661,000
6
Beds
4
Baths
3,748
Sq Ft
$370/Sq Ft
Est. Value
About This Home
This home is located at 180 Spring St, Marshfield, MA 02050 and is currently estimated at $1,385,526, approximately $369 per square foot. 180 Spring St is a home located in Plymouth County with nearby schools including Martinson Elementary School, Furnace Brook Middle School, and Marshfield High School.
Ownership History
Date
Name
Owned For
Owner Type
Purchase Details
Closed on
Apr 7, 2021
Sold by
Carpman Lawrence M and Price-Carpman Pamela
Bought by
Carpman Ft
Current Estimated Value
Purchase Details
Closed on
Jul 22, 1996
Sold by
Herman Bradford and Herman Barbara
Bought by
Carpman Lawrence M and Carpman Pamela P
Create a Home Valuation Report for This Property
The Home Valuation Report is an in-depth analysis detailing your home's value as well as a comparison with similar homes in the area
Home Values in the Area
Average Home Value in this Area
Purchase History
| Date | Buyer | Sale Price | Title Company |
|---|---|---|---|
| Carpman Ft | -- | None Available | |
| Carpman Lawrence M | $280,000 | -- |
Source: Public Records
Mortgage History
| Date | Status | Borrower | Loan Amount |
|---|---|---|---|
| Previous Owner | Carpman Lawrence M | $183,000 | |
| Previous Owner | Carpman Lawrence M | $298,000 |
Source: Public Records
Tax History Compared to Growth
Tax History
| Year | Tax Paid | Tax Assessment Tax Assessment Total Assessment is a certain percentage of the fair market value that is determined by local assessors to be the total taxable value of land and additions on the property. | Land | Improvement |
|---|---|---|---|---|
| 2025 | $9,791 | $989,000 | $371,000 | $618,000 |
| 2024 | $9,224 | $887,800 | $349,200 | $538,600 |
| 2023 | $9,635 | $814,200 | $314,600 | $499,600 |
| 2022 | $9,635 | $744,000 | $258,400 | $485,600 |
| 2021 | $8,450 | $640,600 | $247,500 | $393,100 |
| 2020 | $8,431 | $632,500 | $247,500 | $385,000 |
| 2019 | $8,463 | $632,500 | $247,500 | $385,000 |
| 2018 | $8,457 | $632,500 | $247,500 | $385,000 |
| 2017 | $8,216 | $598,800 | $247,500 | $351,300 |
| 2016 | $8,311 | $598,800 | $247,500 | $351,300 |
| 2015 | $7,958 | $598,800 | $247,500 | $351,300 |
| 2014 | $7,461 | $561,400 | $225,700 | $335,700 |
Source: Public Records
Map
Nearby Homes
- 32 Carolyn Cir
- 64 Carolyn Cir
- 9 Cushing Park Rd
- 26 Damons Point Cir
- 908 Main St
- 480 Pleasant St
- 55 Macombers Way
- 76 Macombers Way
- 17 Old Oaken Bucket Rd
- 29 Ladds Way Unit 29
- 19 Ford Place Unit 3
- 19 Ford Place Unit 1
- 1 Valley Path
- 252 Winter St
- 3 Webster Farm Way
- 5 Webster Farm Way
- 25 Webster Farm Way
- 23 Webster Farm Way
- 734 Main St
- 37 Moorland Rd