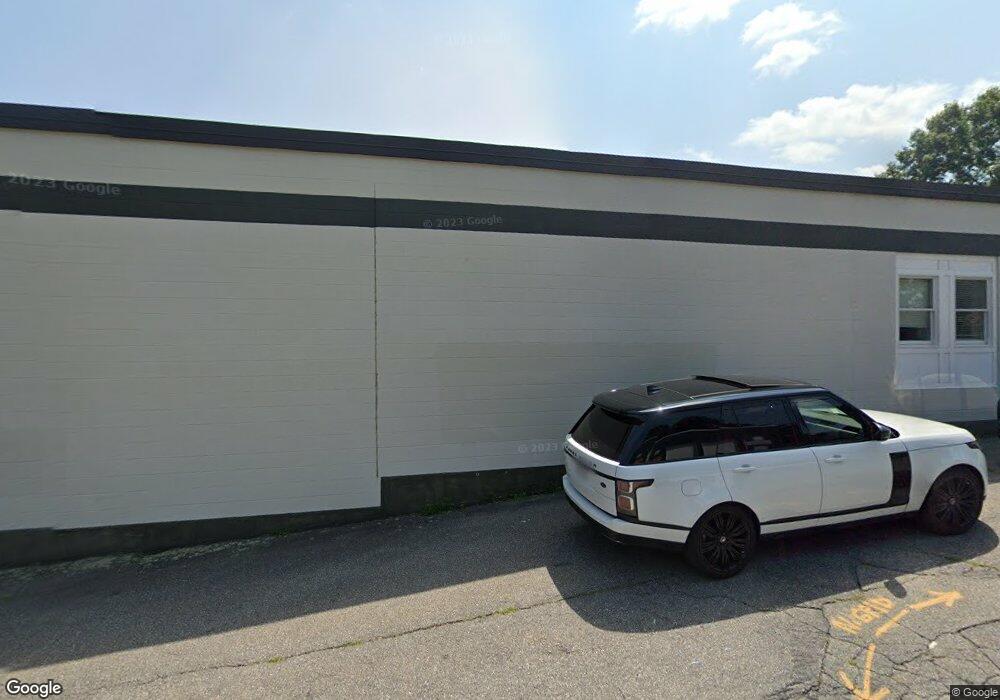
180 Stone St Clinton, MA 01510
Estimated Value: $837,946
--
Bed
1
Bath
800
Sq Ft
$1,047/Sq Ft
Est. Value
About This Home
This home is located at 180 Stone St, Clinton, MA 01510 and is currently estimated at $837,946, approximately $1,047 per square foot. 180 Stone St is a home located in Worcester County with nearby schools including Clinton Elementary School, Clinton Senior High School, and Clinton Middle School.
Ownership History
Date
Name
Owned For
Owner Type
Purchase Details
Closed on
Mar 31, 2022
Sold by
Judith W Innamorati T W and Judith Innamorati
Bought by
417 Bolton Road Llc
Current Estimated Value
Home Financials for this Owner
Home Financials are based on the most recent Mortgage that was taken out on this home.
Original Mortgage
$543,750
Outstanding Balance
$507,126
Interest Rate
3.92%
Mortgage Type
Purchase Money Mortgage
Estimated Equity
$330,820
Purchase Details
Closed on
Mar 24, 2022
Sold by
John B Innamorati T B and John Innamorati
Bought by
417 Bolton Road Llc
Home Financials for this Owner
Home Financials are based on the most recent Mortgage that was taken out on this home.
Original Mortgage
$543,750
Outstanding Balance
$507,126
Interest Rate
3.92%
Mortgage Type
Purchase Money Mortgage
Estimated Equity
$330,820
Purchase Details
Closed on
Apr 29, 2020
Sold by
Innamorati John B
Bought by
Stone John Innamorati 180
Purchase Details
Closed on
Jun 18, 2008
Sold by
Innamorati Albert J
Bought by
Judith W Innamorati T W and Judith Innamorati
Create a Home Valuation Report for This Property
The Home Valuation Report is an in-depth analysis detailing your home's value as well as a comparison with similar homes in the area
Home Values in the Area
Average Home Value in this Area
Purchase History
| Date | Buyer | Sale Price | Title Company |
|---|---|---|---|
| 417 Bolton Road Llc | $725,000 | None Available | |
| 417 Bolton Road Llc | -- | None Available | |
| Stone John Innamorati 180 | -- | None Available | |
| Judith W Innamorati T W | -- | -- | |
| Judith W Innamorati T | -- | -- |
Source: Public Records
Mortgage History
| Date | Status | Borrower | Loan Amount |
|---|---|---|---|
| Open | 417 Bolton Road Llc | $543,750 |
Source: Public Records
Tax History Compared to Growth
Tax History
| Year | Tax Paid | Tax Assessment Tax Assessment Total Assessment is a certain percentage of the fair market value that is determined by local assessors to be the total taxable value of land and additions on the property. | Land | Improvement |
|---|---|---|---|---|
| 2025 | $16,201 | $735,400 | $117,700 | $617,700 |
| 2024 | $9,265 | $424,800 | $117,700 | $307,100 |
| 2023 | $8,748 | $390,200 | $117,400 | $272,800 |
| 2022 | $8,944 | $356,900 | $106,700 | $250,200 |
| 2021 | $9,672 | $356,900 | $106,700 | $250,200 |
| 2020 | $9,583 | $356,900 | $106,700 | $250,200 |
| 2019 | $9,345 | $331,400 | $99,100 | $232,300 |
| 2018 | $10,046 | $326,900 | $89,900 | $237,000 |
| 2017 | $9,620 | $301,100 | $81,700 | $219,400 |
| 2016 | $9,470 | $301,100 | $81,700 | $219,400 |
| 2015 | $8,044 | $257,500 | $79,300 | $178,200 |
| 2014 | $7,774 | $257,500 | $79,300 | $178,200 |
Source: Public Records
Map
Nearby Homes
- 201 Stone St Unit 203
- 201-203 Stone St
- 459 High St
- 22 Forest Ave
- 1 Grady St
- 57 Clark St
- 0 Parker Rd
- 216 Walnut St
- 55 Sterling St Unit 306
- 55 Sterling St Unit 314
- 55 Sterling St Unit 212
- 30 John F. Kennedy Ave
- 23 Ash St
- 89 1/2 Walnut St
- 19 Magnolia Ave
- 136 Mill St
- 51 Rigby St
- 155 Cedar St
- 12 Woodruff Rd
- 92 Mill St