180 Teal Ct Unit LOT B-24 Senoia, GA 30276
Estimated Value: $449,000 - $483,000
4
Beds
3
Baths
2,343
Sq Ft
$201/Sq Ft
Est. Value
About This Home
This home is located at 180 Teal Ct Unit LOT B-24, Senoia, GA 30276 and is currently estimated at $470,613, approximately $200 per square foot. 180 Teal Ct Unit LOT B-24 is a home located in Coweta County with nearby schools including Willis Road Elementary School, East Coweta Middle School, and East Coweta High School.
Ownership History
Date
Name
Owned For
Owner Type
Purchase Details
Closed on
Aug 19, 2014
Sold by
Jeff Lindsey Communities Inc
Bought by
Kachin Aleandre A and Kachin Stephanie P
Current Estimated Value
Home Financials for this Owner
Home Financials are based on the most recent Mortgage that was taken out on this home.
Original Mortgage
$208,000
Outstanding Balance
$159,131
Interest Rate
4.2%
Mortgage Type
VA
Estimated Equity
$311,482
Purchase Details
Closed on
Oct 7, 2013
Sold by
High Ridge Homes Inc
Bought by
Jeff Lindsey Communities Inc
Purchase Details
Closed on
May 30, 2013
Sold by
Kauffmann Janice
Bought by
High Ridge Homes Inc
Purchase Details
Closed on
Feb 22, 2013
Sold by
Metcalf Homes Inc
Bought by
Kauffmann Janice
Purchase Details
Closed on
Dec 21, 2004
Sold by
Benchmark Superior Homes Inc
Bought by
Metcalf Homes Inc
Purchase Details
Closed on
Aug 1, 2002
Sold by
Twin Lakes Partnership
Bought by
Benchmark Superior Homes Inc
Create a Home Valuation Report for This Property
The Home Valuation Report is an in-depth analysis detailing your home's value as well as a comparison with similar homes in the area
Home Values in the Area
Average Home Value in this Area
Purchase History
| Date | Buyer | Sale Price | Title Company |
|---|---|---|---|
| Kachin Aleandre A | $208,000 | -- | |
| Jeff Lindsey Communities Inc | $90,000 | -- | |
| High Ridge Homes Inc | -- | -- | |
| Kauffmann Janice | $45,000 | -- | |
| Metcalf Homes Inc | $360,000 | -- | |
| Benchmark Superior Homes Inc | $330,700 | -- |
Source: Public Records
Mortgage History
| Date | Status | Borrower | Loan Amount |
|---|---|---|---|
| Open | Kachin Aleandre A | $208,000 |
Source: Public Records
Tax History Compared to Growth
Tax History
| Year | Tax Paid | Tax Assessment Tax Assessment Total Assessment is a certain percentage of the fair market value that is determined by local assessors to be the total taxable value of land and additions on the property. | Land | Improvement |
|---|---|---|---|---|
| 2024 | $5,153 | $185,351 | $32,000 | $153,351 |
| 2023 | $5,153 | $172,522 | $32,000 | $140,522 |
| 2022 | $4,334 | $148,305 | $26,000 | $122,305 |
| 2021 | $3,883 | $122,572 | $22,000 | $100,572 |
| 2020 | $3,797 | $117,644 | $22,000 | $95,644 |
| 2019 | $3,228 | $90,361 | $16,000 | $74,361 |
| 2018 | $3,245 | $90,361 | $16,000 | $74,361 |
| 2017 | $3,025 | $83,817 | $16,000 | $67,817 |
| 2016 | $3,021 | $83,817 | $16,000 | $67,817 |
| 2015 | $2,787 | $78,519 | $8,000 | $70,519 |
| 2014 | $283 | $8,000 | $8,000 | $0 |
Source: Public Records
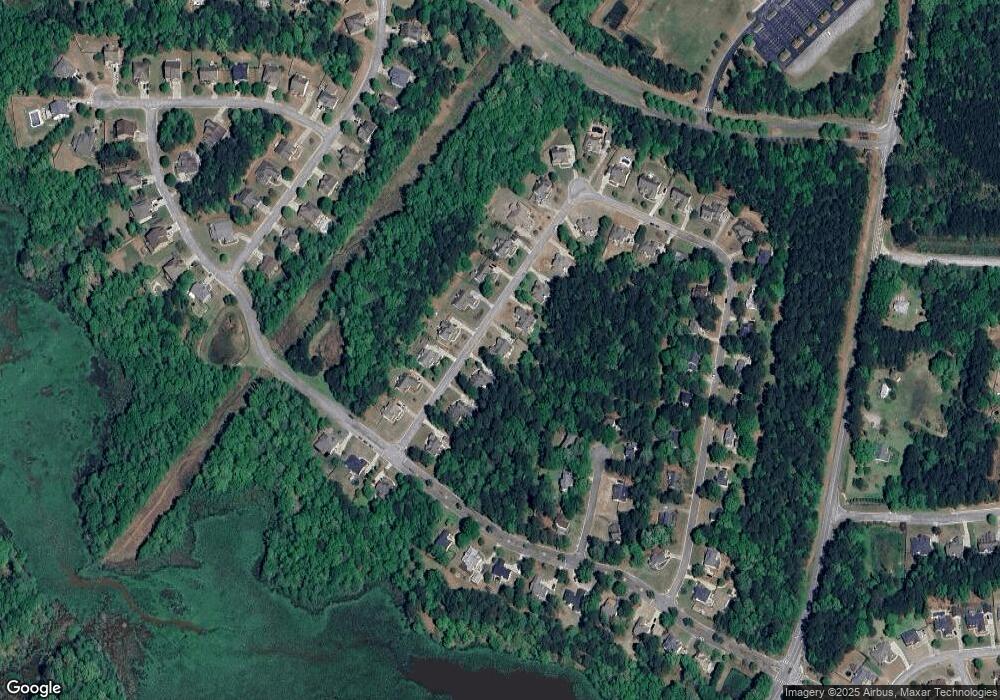
Map
Nearby Homes
- 70 Teal Ct
- 20 Palladian Dr
- 160 Blue Heron Blvd
- 181 Brittany Ln
- 186 Brittany Ln
- 35 Paddle Boat Cove
- 135 Mulberry Dr
- 165 Tudor Way
- 315 Emerald Way
- 631 Rockaway Rd
- 325 Ivy Ln
- 225 Renwick Dr
- 305 Staffin Dr
- 270 Staffin Dr
- 260 Staffin Dr
- SAVANNAH Plan at Heritage Pointe
- Jean Lee Plan at Heritage Pointe
- Hampshire Plan at Heritage Pointe
- Edison Plan at Heritage Pointe
- Marlene Plan at Heritage Pointe