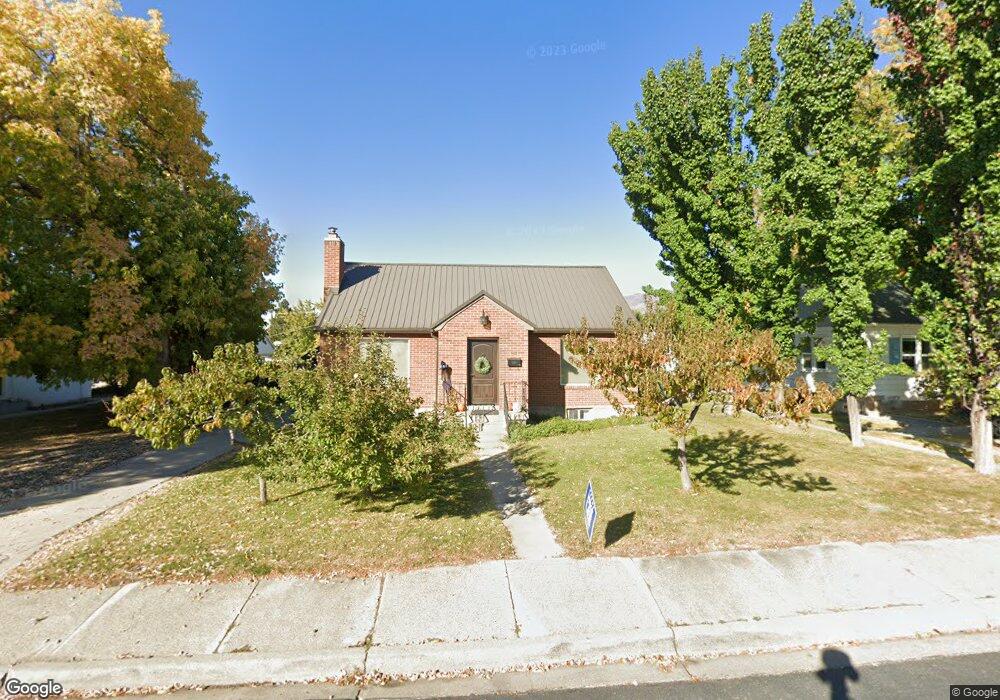
180 W 100 N Bountiful, UT 84010
Estimated Value: $429,000 - $538,000
3
Beds
2
Baths
2,124
Sq Ft
$227/Sq Ft
Est. Value
About This Home
This home is located at 180 W 100 N, Bountiful, UT 84010 and is currently estimated at $481,953, approximately $226 per square foot. 180 W 100 N is a home located in Davis County with nearby schools including Meadowbrook Elementary School, Bountiful Junior High School, and Bountiful High School.
Ownership History
Date
Name
Owned For
Owner Type
Purchase Details
Closed on
Dec 16, 2022
Sold by
Hubbard Jane E
Bought by
Hubco Llc
Current Estimated Value
Purchase Details
Closed on
Jun 3, 1997
Sold by
Allsop Brent J and Allsop Heidi R
Bought by
Hubbard Jane E
Home Financials for this Owner
Home Financials are based on the most recent Mortgage that was taken out on this home.
Original Mortgage
$112,400
Interest Rate
8.08%
Purchase Details
Closed on
Nov 11, 1996
Sold by
Schroeder Mario and Schroeder Alicia D
Bought by
Allsop Brent J and Allsop Heidi R
Home Financials for this Owner
Home Financials are based on the most recent Mortgage that was taken out on this home.
Original Mortgage
$87,000
Interest Rate
8.06%
Mortgage Type
Balloon
Create a Home Valuation Report for This Property
The Home Valuation Report is an in-depth analysis detailing your home's value as well as a comparison with similar homes in the area
Purchase History
| Date | Buyer | Sale Price | Title Company |
|---|---|---|---|
| Hubco Llc | -- | -- | |
| Hubco Llc | -- | None Listed On Document | |
| Hubbard Jane E | -- | Bonneville Title Company Inc | |
| Allsop Brent J | -- | Bonneville Title Company Inc | |
| Allsop Brent J | -- | Bonneville Title Company Inc |
Source: Public Records
Mortgage History
| Date | Status | Borrower | Loan Amount |
|---|---|---|---|
| Previous Owner | Hubbard Jane E | $112,400 | |
| Previous Owner | Allsop Brent J | $87,000 |
Source: Public Records
Tax History
| Year | Tax Paid | Tax Assessment Tax Assessment Total Assessment is a certain percentage of the fair market value that is determined by local assessors to be the total taxable value of land and additions on the property. | Land | Improvement |
|---|---|---|---|---|
| 2025 | -- | $237,600 | $140,770 | $96,830 |
| 2024 | -- | $230,449 | $128,401 | $102,048 |
| 2023 | $2,395 | $220,550 | $128,596 | $91,953 |
| 2022 | $2,382 | $397,000 | $230,959 | $166,041 |
| 2021 | $0 | $312,000 | $166,347 | $145,653 |
| 2020 | $1,970 | $277,000 | $141,105 | $135,895 |
| 2019 | $1,913 | $262,000 | $142,442 | $119,558 |
| 2018 | $1,766 | $237,000 | $139,480 | $97,520 |
| 2016 | $1,556 | $113,300 | $59,798 | $53,502 |
| 2015 | $1,512 | $103,730 | $59,798 | $43,932 |
| 2014 | $1,573 | $112,002 | $59,798 | $52,204 |
| 2013 | -- | $97,084 | $43,945 | $53,139 |
Source: Public Records
Map
Nearby Homes
- 320 N 200 W Unit 4
- 75 N Peregrine Ln W Unit 8
- 332 N 300 W
- 252 N Main St
- 254 N Main St
- 256 N Main St
- 51 E 200 N Unit 3
- 55 E 200 N Unit 2
- 41 E 200 N Unit 6
- 49 E 200 N Unit 4
- 499 N 200 W Unit 30
- 399 W 400 N Unit 47
- 401 W 400 N Unit 49
- 563 N 200 W
- 290 N 500 W Unit 305
- 93 W 700 N
- 106 W 700 N
- 32 W 400 S
- 34 W 400 S
- 184 Park Shadows Cir
Your Personal Tour Guide
Ask me questions while you tour the home.