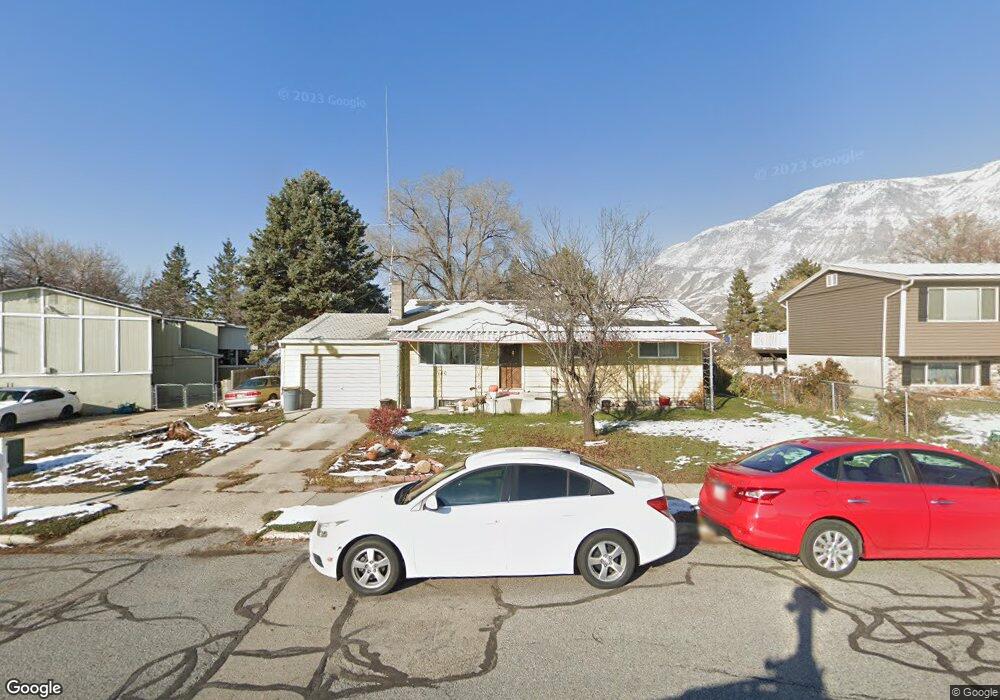
180 W 800 N Pleasant Grove, UT 84062
Estimated Value: $460,000 - $513,000
4
Beds
1
Bath
1,824
Sq Ft
$264/Sq Ft
Est. Value
About This Home
This home is located at 180 W 800 N, Pleasant Grove, UT 84062 and is currently estimated at $480,711, approximately $263 per square foot. 180 W 800 N is a home located in Utah County with nearby schools including Mount Mahogany School, Pleasant Grove Junior High School, and Pleasant Grove High School.
Ownership History
Date
Name
Owned For
Owner Type
Purchase Details
Closed on
Jul 12, 2006
Sold by
Jacklin Bill Elwood and Jacklin Grace Janet
Bought by
Duran Erendida Pluma
Current Estimated Value
Purchase Details
Closed on
Jun 2, 1999
Sold by
Caton Wallace Arango Nilson & Associates
Bought by
H & S Investments Llc
Home Financials for this Owner
Home Financials are based on the most recent Mortgage that was taken out on this home.
Original Mortgage
$511,755
Interest Rate
6.84%
Purchase Details
Closed on
Nov 20, 1998
Sold by
Jacklin Bill E and Jacklin Grace Janet
Bought by
Jacklin Bill Elwood and Jacklin Grace Janet
Home Financials for this Owner
Home Financials are based on the most recent Mortgage that was taken out on this home.
Original Mortgage
$109,000
Interest Rate
6.84%
Create a Home Valuation Report for This Property
The Home Valuation Report is an in-depth analysis detailing your home's value as well as a comparison with similar homes in the area
Home Values in the Area
Average Home Value in this Area
Purchase History
| Date | Buyer | Sale Price | Title Company |
|---|---|---|---|
| Duran Erendida Pluma | -- | First American Title Agency | |
| H & S Investments Llc | -- | First American Title Co | |
| Jacklin Bill Elwood | -- | Backman Stewart Title |
Source: Public Records
Mortgage History
| Date | Status | Borrower | Loan Amount |
|---|---|---|---|
| Previous Owner | H & S Investments Llc | $511,755 | |
| Previous Owner | Jacklin Bill Elwood | $109,000 |
Source: Public Records
Tax History Compared to Growth
Tax History
| Year | Tax Paid | Tax Assessment Tax Assessment Total Assessment is a certain percentage of the fair market value that is determined by local assessors to be the total taxable value of land and additions on the property. | Land | Improvement |
|---|---|---|---|---|
| 2025 | $1,905 | $238,755 | $209,100 | $225,000 |
| 2024 | $1,905 | $227,425 | $0 | $0 |
| 2023 | $1,875 | $229,020 | $0 | $0 |
| 2022 | $1,990 | $241,945 | $0 | $0 |
| 2021 | $1,717 | $317,800 | $150,000 | $167,800 |
| 2020 | $1,578 | $286,400 | $133,900 | $152,500 |
| 2019 | $1,362 | $255,600 | $123,000 | $132,600 |
| 2018 | $1,304 | $231,300 | $112,200 | $119,100 |
| 2017 | $1,151 | $108,735 | $0 | $0 |
| 2016 | $1,127 | $102,795 | $0 | $0 |
| 2015 | $1,134 | $97,955 | $0 | $0 |
| 2014 | $1,081 | $92,455 | $0 | $0 |
Source: Public Records
Map
Nearby Homes
- 1152 N 200 W
- 685 W 1000 N
- 405 N 200 E
- 825 N 350 E
- 344 E 900 N
- 854 N 1010 W
- 1051 N 600 W
- 1031 N 600 W
- 1041 N 600 W
- 909 W 1180 N
- 146 N 200 E
- 1656 N Siena Cir Unit 7
- 1534 N 750 W Unit 16
- 731 W 1590 N Unit 15
- Konlee Plan at Makin Dreams
- Alexa Plan at Makin Dreams
- Callahan Plan at Makin Dreams
- Hailey Plan at Makin Dreams
- Alydia Plan at Makin Dreams
- Addison Plan at Makin Dreams