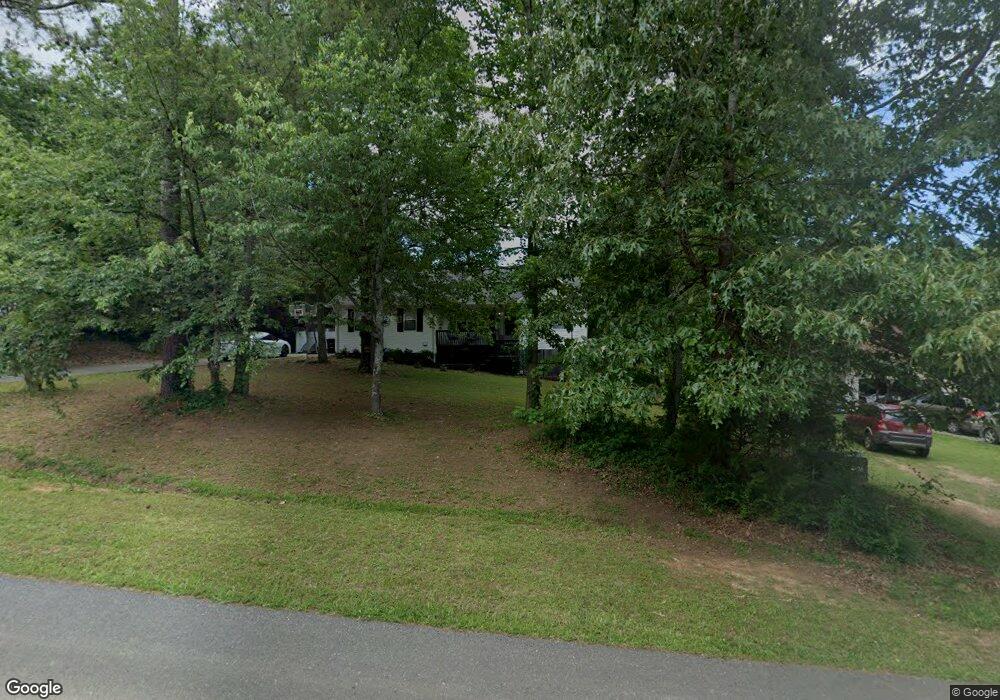
180 Walraven Way SE Unit 204 Calhoun, GA 30701
Estimated Value: $242,000 - $281,000
3
Beds
2
Baths
1,984
Sq Ft
$132/Sq Ft
Est. Value
About This Home
This home is located at 180 Walraven Way SE Unit 204, Calhoun, GA 30701 and is currently estimated at $262,325, approximately $132 per square foot. 180 Walraven Way SE Unit 204 is a home located in Gordon County with nearby schools including Red Bud Elementary School, Red Bud Middle School, and Sonoraville High School.
Ownership History
Date
Name
Owned For
Owner Type
Purchase Details
Closed on
Mar 20, 2023
Sold by
Patel Bhavikkumar V
Bought by
Patel Bhavikkumar Vinaykumar and Patel Susan Dianne
Current Estimated Value
Home Financials for this Owner
Home Financials are based on the most recent Mortgage that was taken out on this home.
Original Mortgage
$43,900
Outstanding Balance
$38,941
Interest Rate
5.76%
Mortgage Type
New Conventional
Estimated Equity
$223,384
Purchase Details
Closed on
Feb 15, 2017
Sold by
Friend Andrew
Bought by
Patel V Bhavikkumar
Home Financials for this Owner
Home Financials are based on the most recent Mortgage that was taken out on this home.
Original Mortgage
$126,262
Interest Rate
4.09%
Mortgage Type
New Conventional
Purchase Details
Closed on
Jun 20, 2003
Sold by
Inabnit Carrie Davids
Bought by
Friend Andrew and Friend Helen
Purchase Details
Closed on
Mar 22, 1999
Bought by
Inabnit Carrie Davids
Create a Home Valuation Report for This Property
The Home Valuation Report is an in-depth analysis detailing your home's value as well as a comparison with similar homes in the area
Home Values in the Area
Average Home Value in this Area
Purchase History
| Date | Buyer | Sale Price | Title Company |
|---|---|---|---|
| Patel Bhavikkumar Vinaykumar | -- | -- | |
| Patel V Bhavikkumar | $125,000 | -- | |
| Friend Andrew | $99,900 | -- | |
| Inabnit Carrie Davids | $79,000 | -- |
Source: Public Records
Mortgage History
| Date | Status | Borrower | Loan Amount |
|---|---|---|---|
| Open | Patel Bhavikkumar Vinaykumar | $43,900 | |
| Previous Owner | Patel V Bhavikkumar | $126,262 |
Source: Public Records
Tax History Compared to Growth
Tax History
| Year | Tax Paid | Tax Assessment Tax Assessment Total Assessment is a certain percentage of the fair market value that is determined by local assessors to be the total taxable value of land and additions on the property. | Land | Improvement |
|---|---|---|---|---|
| 2024 | $2,160 | $87,024 | $6,440 | $80,584 |
| 2023 | $2,007 | $81,000 | $6,440 | $74,560 |
| 2022 | $1,983 | $75,412 | $6,440 | $68,972 |
| 2021 | $1,657 | $61,160 | $6,440 | $54,720 |
| 2020 | $1,560 | $56,440 | $5,880 | $50,560 |
| 2019 | $1,569 | $56,480 | $5,880 | $50,600 |
| 2018 | $1,285 | $46,600 | $5,040 | $41,560 |
| 2017 | $492 | $44,000 | $5,040 | $38,960 |
| 2016 | $371 | $39,640 | $4,760 | $34,880 |
| 2015 | $366 | $38,880 | $4,760 | $34,120 |
| 2014 | $892 | $32,628 | $4,200 | $28,428 |
Source: Public Records
Map
Nearby Homes
- 0 Libby Ln SE Unit 10275212
- 0 Libby Ln SE Unit 7362041
- 0 Buck Blvd SE Unit 7362017
- 0 Buck Blvd SE Unit 10275210
- 177 Frix Ln SE
- 191 Frix Ln SE
- 4134 Dews Pond Rd SE
- 192 Cardinal Blvd SE
- 194 Cardinal Blvd SE
- 408 Peachtree Ln SE
- 0 Covington Bridge Rd SE Unit 10558075
- 0 Covington Bridge Rd SE Unit 7610123
- 702 Cash Rd SE
- 00002 Lovebridge Rd SE
- lot 4 Lovebridge Rd SE
- 137 Hunters Trail SE
- 0 Hunts Gin Rd L2
- 127 Alex Ct
- 320 School House Rd NE
- 367 School House Rd NE
- 180 Walraven Way SE
- 170 Walraven Way SE
- 190 Walraven Way SE
- 160 Walraven Way SE
- 181 Walraven Way SE
- 191 Walraven Way SE
- 210 Walraven Way SE
- 171 Walraven Way SE
- 150 Walraven Way SE
- 0 Walraven Way SE Unit 9002479
- 0 Walraven Way SE Unit 7414422
- 0 Walraven Way SE
- 161 Walraven Way SE
- 620 Buck Blvd SE
- 610 Buck Blvd SE
- 211 Walraven Way SE
- 600 Buck Blvd SE
- 640 Buck Blvd SE
- 220 Walraven Way SE
- 140 Walraven Way SE