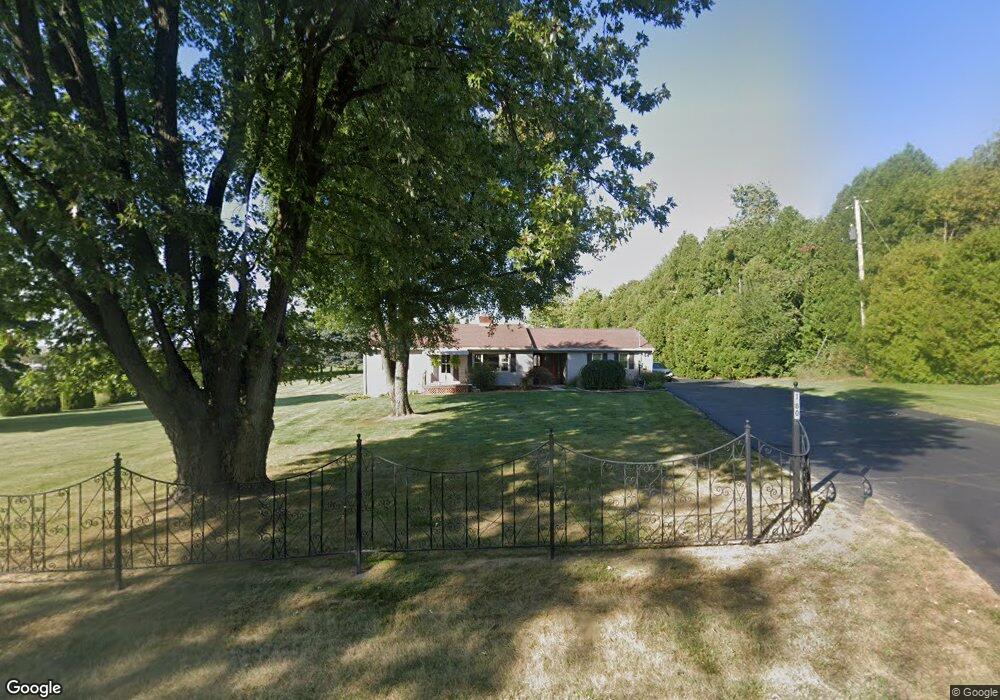
180 Willow Rd Springfield, OH 45502
Estimated Value: $270,505 - $348,000
3
Beds
2
Baths
2,400
Sq Ft
$130/Sq Ft
Est. Value
About This Home
This home is located at 180 Willow Rd, Springfield, OH 45502 and is currently estimated at $311,376, approximately $129 per square foot. 180 Willow Rd is a home located in Clark County with nearby schools including Northridge Elementary School, Kenton Ridge Middle & High School, and Catholic Central Elementary School - Limestone Campus.
Ownership History
Date
Name
Owned For
Owner Type
Purchase Details
Closed on
May 9, 2014
Sold by
Dewitt Larry T and Dewitt Alicia M
Bought by
Tatman Carl L and Peters Shirley A
Current Estimated Value
Home Financials for this Owner
Home Financials are based on the most recent Mortgage that was taken out on this home.
Original Mortgage
$163,975
Outstanding Balance
$123,493
Interest Rate
4.25%
Mortgage Type
FHA
Estimated Equity
$187,883
Purchase Details
Closed on
Jan 13, 2014
Sold by
Crall Chris E and Crall Deonna J
Bought by
Dewitt Larry T and Dewitt Alicia M
Purchase Details
Closed on
Jan 10, 2014
Sold by
Crall Randall J and Crall Deborah W
Bought by
Dewitt Larry T and Dewitt Alicia M
Purchase Details
Closed on
Dec 20, 1991
Sold by
Crall John S and Crall Doris J
Bought by
Dewitt Larry T and Dewitt Alicia M
Create a Home Valuation Report for This Property
The Home Valuation Report is an in-depth analysis detailing your home's value as well as a comparison with similar homes in the area
Purchase History
| Date | Buyer | Sale Price | Title Company |
|---|---|---|---|
| Tatman Carl L | $167,000 | Attorney | |
| Dewitt Larry T | -- | Attorney | |
| Dewitt Larry T | -- | Attorney | |
| Dewitt Larry T | -- | Attorney | |
| Dewitt Larry T | -- | Attorney | |
| Dewitt Larry T | $82,400 | -- |
Source: Public Records
Mortgage History
| Date | Status | Borrower | Loan Amount |
|---|---|---|---|
| Open | Tatman Carl L | $163,975 |
Source: Public Records
Tax History
| Year | Tax Paid | Tax Assessment Tax Assessment Total Assessment is a certain percentage of the fair market value that is determined by local assessors to be the total taxable value of land and additions on the property. | Land | Improvement |
|---|---|---|---|---|
| 2025 | $2,674 | $74,400 | $19,660 | $54,740 |
| 2024 | $2,587 | $59,830 | $15,250 | $44,580 |
| 2023 | $2,587 | $59,830 | $15,250 | $44,580 |
| 2022 | $2,597 | $59,830 | $15,250 | $44,580 |
| 2021 | $2,571 | $50,180 | $12,500 | $37,680 |
| 2020 | $2,573 | $50,180 | $12,500 | $37,680 |
| 2019 | $2,622 | $50,180 | $12,500 | $37,680 |
| 2018 | $2,421 | $44,460 | $11,580 | $32,880 |
| 2017 | $2,084 | $44,461 | $11,578 | $32,883 |
| 2016 | $2,070 | $44,461 | $11,578 | $32,883 |
| 2015 | $2,033 | $42,070 | $11,578 | $30,492 |
| 2014 | $1,569 | $42,070 | $11,578 | $30,492 |
| 2013 | $767 | $42,070 | $11,578 | $30,492 |
Source: Public Records
Map
Nearby Homes
- 335 Willow Rd
- 937 Willow Rd
- 5300 Brookshire Ln
- 1398 Elizabeth Ct Unit 66
- 1470 Oldham Dr Unit 12
- 5235 W Ridgewood Rd
- 519 Moorefield Rd
- 1309 Richmoor Rd
- 0 Moorefield Rd
- 5646 Springfield-Urbana Pike Unit Lot 30
- 5646 Springfield-Urbana Pike Unit Lot 90
- 5646 Springfield-Urbana Pike Unit Lot 61
- 5646 Springfield-Urbana Pike Unit Lot 72
- 5645 Springfield-Urbana Pike Unit Lot 67
- 1521 Erika Dr
- 4733 Curtis Dr
- 4741 Cullen Ave
- 4802 Willowbrook Dr
- 1977 Willoughby Ave
- 1052 Cheyenne Ave Unit 1052
Your Personal Tour Guide
Ask me questions while you tour the home.