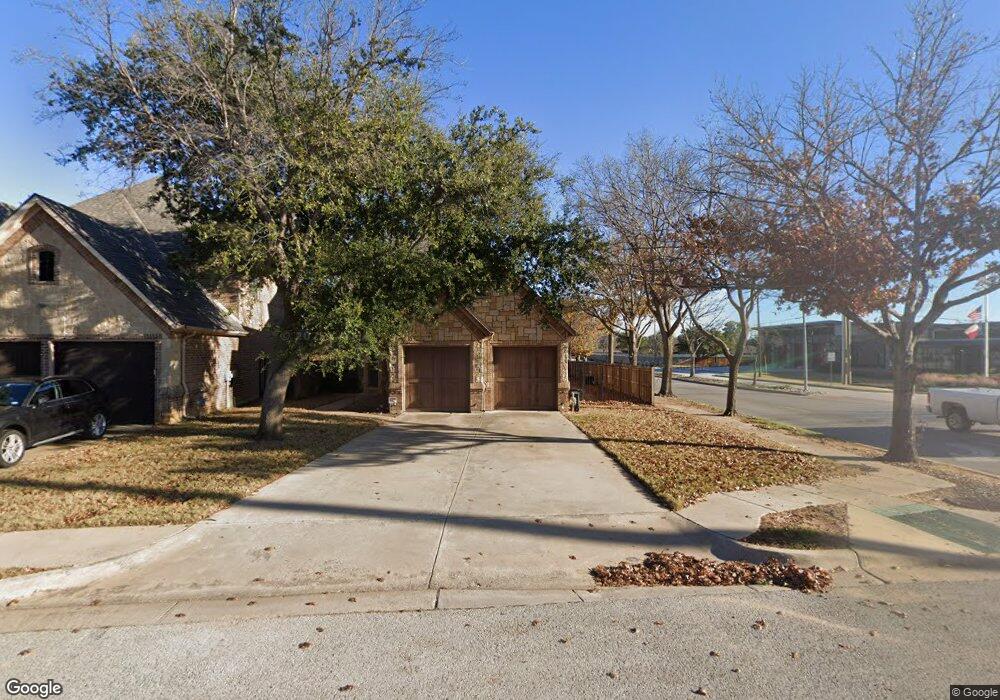
1800 Castle Ct Grapevine, TX 76051
Estimated Value: $583,281 - $704,000
4
Beds
3
Baths
2,492
Sq Ft
$263/Sq Ft
Est. Value
About This Home
This home is located at 1800 Castle Ct, Grapevine, TX 76051 and is currently estimated at $654,820, approximately $262 per square foot. 1800 Castle Ct is a home located in Tarrant County with nearby schools including Jack D. Johnson Elementary, Don T. Durham Intermediate School, and Carroll Middle School.
Ownership History
Date
Name
Owned For
Owner Type
Purchase Details
Closed on
Apr 16, 2025
Sold by
Jia Hongmei
Bought by
Jia Hongmei and Webb Kenn W
Current Estimated Value
Purchase Details
Closed on
Jul 24, 2020
Sold by
Rieck Brian and Rieck Jennifer
Bought by
Jia Hongmei
Home Financials for this Owner
Home Financials are based on the most recent Mortgage that was taken out on this home.
Original Mortgage
$339,500
Interest Rate
3.2%
Mortgage Type
New Conventional
Purchase Details
Closed on
May 15, 2014
Sold by
Gobson Smith Elizabeth
Bought by
Rieck Brian and Rieck Jennifer
Purchase Details
Closed on
Dec 28, 2006
Sold by
Mcpherson Construction Co Inc
Bought by
Gibson Smith Elizabeth
Home Financials for this Owner
Home Financials are based on the most recent Mortgage that was taken out on this home.
Original Mortgage
$242,000
Interest Rate
6.1%
Mortgage Type
Purchase Money Mortgage
Create a Home Valuation Report for This Property
The Home Valuation Report is an in-depth analysis detailing your home's value as well as a comparison with similar homes in the area
Home Values in the Area
Average Home Value in this Area
Purchase History
| Date | Buyer | Sale Price | Title Company |
|---|---|---|---|
| Jia Hongmei | -- | None Listed On Document | |
| Jia Hongmei | -- | Independence Title Company | |
| Rieck Brian | -- | Freedom Title | |
| Gibson Smith Elizabeth | -- | None Available |
Source: Public Records
Mortgage History
| Date | Status | Borrower | Loan Amount |
|---|---|---|---|
| Previous Owner | Jia Hongmei | $339,500 | |
| Previous Owner | Gibson Smith Elizabeth | $242,000 |
Source: Public Records
Tax History Compared to Growth
Tax History
| Year | Tax Paid | Tax Assessment Tax Assessment Total Assessment is a certain percentage of the fair market value that is determined by local assessors to be the total taxable value of land and additions on the property. | Land | Improvement |
|---|---|---|---|---|
| 2025 | $5,633 | $435,000 | $110,000 | $325,000 |
| 2024 | $5,633 | $490,000 | $110,000 | $380,000 |
| 2023 | $7,684 | $438,000 | $110,000 | $328,000 |
| 2022 | $8,174 | $429,873 | $110,000 | $319,873 |
| 2021 | $9,307 | $431,370 | $110,000 | $321,370 |
| 2020 | $8,385 | $432,868 | $110,000 | $322,868 |
| 2019 | $7,942 | $434,366 | $110,000 | $324,366 |
| 2018 | $5,952 | $318,926 | $110,000 | $208,926 |
| 2017 | $6,686 | $410,554 | $70,000 | $340,554 |
| 2016 | $6,078 | $263,575 | $70,000 | $193,575 |
| 2015 | $7,647 | $340,500 | $25,000 | $315,500 |
| 2014 | $7,647 | $340,500 | $25,000 | $315,500 |
Source: Public Records
Map
Nearby Homes
- 2023 Harwell St
- 2002 Harwell St
- 2941 Kosse Ct
- Walker Plan at Dove Station
- Florence Plan at Dove Station
- Jade Plan at Dove Station
- 1480 N Kimball Ave
- 2947 Kosse Ct
- 2944 Chris Ln
- 2080 E Dove Rd Unit Lot 4
- 2080 E Dove Rd Unit Lots 1, 2, 4, 5, 6
- 2080 E Dove Rd Unit Lot 2
- 2080 E (Lot 1) Dove Rd
- 2080 E Dove Rd Unit Lot 6
- 2040 E Dove Rd
- 2920 Cripple Creek Trail
- 1963 E Dove Rd
- 2921 Mesa Verde Trail
- 2804 Stonehurst Dr
- 2709 Cobblestone Dr
- 1804 Castle Ct
- 1808 Castle Ct
- 2011 Harwell St
- 1801 Castle Ct
- 2015 Harwell St
- 1812 Castle Ct
- 2019 Harwell St
- 1816 Castle Ct
- 1805 Castle Ct
- 1809 Castle Ct
- 2010 Harwell St
- 2006 Harwell St
- 2014 Harwell St
- 2108 N Kimball Ave
- 2018 Harwell St
- 2027 Harwell St
- 1500 N Kimball Ave
- 2022 Harwell St
- 3032 Alice Ct
- 2318 Kimball Glen Ct