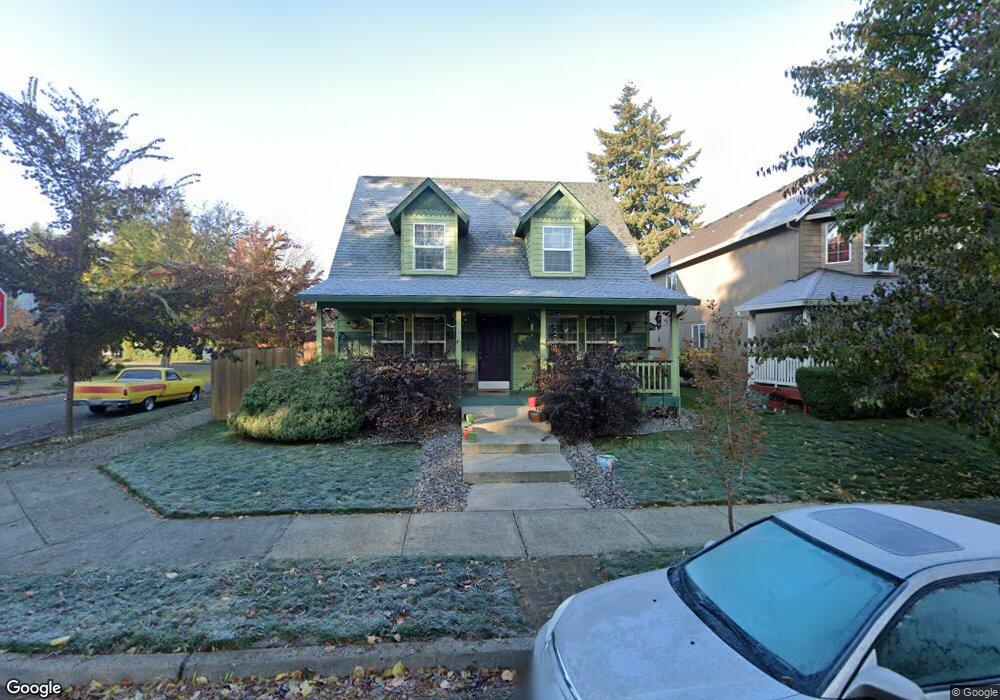
1800 E 38th Loop Vancouver, WA 98663
Rose Village NeighborhoodEstimated Value: $423,000 - $435,462
3
Beds
3
Baths
1,422
Sq Ft
$303/Sq Ft
Est. Value
About This Home
This home is located at 1800 E 38th Loop, Vancouver, WA 98663 and is currently estimated at $430,366, approximately $302 per square foot. 1800 E 38th Loop is a home located in Clark County with nearby schools including Washington Elementary School, Discovery Middle School, and Hudson's Bay High School.
Ownership History
Date
Name
Owned For
Owner Type
Purchase Details
Closed on
Jan 9, 1998
Sold by
Center Monty L and Center Julie A
Bought by
Mcpherson Rory and Goodson Shawnda R
Current Estimated Value
Home Financials for this Owner
Home Financials are based on the most recent Mortgage that was taken out on this home.
Original Mortgage
$127,659
Outstanding Balance
$22,155
Interest Rate
7.14%
Mortgage Type
FHA
Estimated Equity
$408,211
Create a Home Valuation Report for This Property
The Home Valuation Report is an in-depth analysis detailing your home's value as well as a comparison with similar homes in the area
Home Values in the Area
Average Home Value in this Area
Purchase History
| Date | Buyer | Sale Price | Title Company |
|---|---|---|---|
| Mcpherson Rory | $129,000 | Clark County Title |
Source: Public Records
Mortgage History
| Date | Status | Borrower | Loan Amount |
|---|---|---|---|
| Open | Mcpherson Rory | $127,659 |
Source: Public Records
Tax History
| Year | Tax Paid | Tax Assessment Tax Assessment Total Assessment is a certain percentage of the fair market value that is determined by local assessors to be the total taxable value of land and additions on the property. | Land | Improvement |
|---|---|---|---|---|
| 2025 | $3,632 | $356,366 | $144,000 | $212,366 |
| 2024 | $3,417 | $371,715 | $144,000 | $227,715 |
| 2023 | $3,343 | $365,065 | $142,800 | $222,265 |
| 2022 | $3,111 | $358,603 | $139,200 | $219,403 |
| 2021 | $3,098 | $310,870 | $120,000 | $190,870 |
| 2020 | $2,836 | $291,812 | $112,750 | $179,062 |
| 2019 | $2,579 | $276,792 | $99,550 | $177,242 |
| 2018 | $2,678 | $260,755 | $0 | $0 |
| 2017 | $2,261 | $224,838 | $0 | $0 |
| 2016 | $2,090 | $197,997 | $0 | $0 |
Source: Public Records
Map
Nearby Homes
Your Personal Tour Guide
Ask me questions while you tour the home.