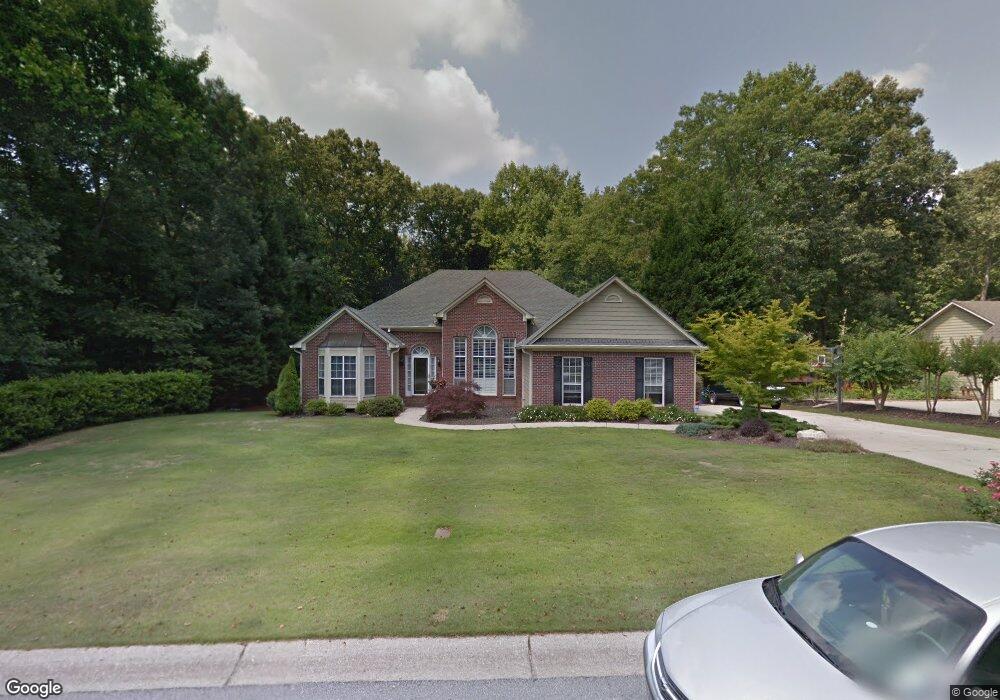
1800 Huntington Hill Trace Unit 2 Buford, GA 30519
Estimated Value: $411,000 - $655,000
3
Beds
2
Baths
2,142
Sq Ft
$250/Sq Ft
Est. Value
About This Home
This home is located at 1800 Huntington Hill Trace Unit 2, Buford, GA 30519 and is currently estimated at $535,170, approximately $249 per square foot. 1800 Huntington Hill Trace Unit 2 is a home located in Gwinnett County with nearby schools including Duncan Creek Elementary School, Frank N. Osborne Middle School, and Mill Creek High School.
Ownership History
Date
Name
Owned For
Owner Type
Purchase Details
Closed on
Jun 26, 2009
Sold by
Metz Delbert N
Bought by
Metz Delbert N and Metz Joyelle W
Current Estimated Value
Home Financials for this Owner
Home Financials are based on the most recent Mortgage that was taken out on this home.
Original Mortgage
$128,000
Interest Rate
4.48%
Mortgage Type
New Conventional
Purchase Details
Closed on
Feb 13, 2003
Sold by
Metz Donna L
Bought by
Metz Delbert N
Home Financials for this Owner
Home Financials are based on the most recent Mortgage that was taken out on this home.
Original Mortgage
$157,000
Interest Rate
5.82%
Mortgage Type
New Conventional
Purchase Details
Closed on
Dec 7, 1998
Sold by
Metz Delbert N
Bought by
Metz Delbert N and Metz Donna L
Home Financials for this Owner
Home Financials are based on the most recent Mortgage that was taken out on this home.
Original Mortgage
$158,650
Interest Rate
6.84%
Mortgage Type
New Conventional
Create a Home Valuation Report for This Property
The Home Valuation Report is an in-depth analysis detailing your home's value as well as a comparison with similar homes in the area
Home Values in the Area
Average Home Value in this Area
Purchase History
| Date | Buyer | Sale Price | Title Company |
|---|---|---|---|
| Metz Delbert N | -- | -- | |
| Metz Delbert N | -- | -- | |
| Metz Delbert N | -- | -- | |
| Metz Delbert N | $167,000 | -- |
Source: Public Records
Mortgage History
| Date | Status | Borrower | Loan Amount |
|---|---|---|---|
| Closed | Metz Delbert N | $128,000 | |
| Previous Owner | Metz Delbert N | $157,000 | |
| Previous Owner | Metz Delbert N | $158,650 |
Source: Public Records
Tax History Compared to Growth
Tax History
| Year | Tax Paid | Tax Assessment Tax Assessment Total Assessment is a certain percentage of the fair market value that is determined by local assessors to be the total taxable value of land and additions on the property. | Land | Improvement |
|---|---|---|---|---|
| 2024 | $5,650 | $214,840 | $30,800 | $184,040 |
| 2023 | $5,650 | $214,840 | $30,800 | $184,040 |
| 2022 | $4,911 | $180,560 | $27,200 | $153,360 |
| 2021 | $4,281 | $146,400 | $19,280 | $127,120 |
| 2020 | $3,974 | $130,640 | $18,360 | $112,280 |
| 2019 | $3,887 | $130,640 | $18,360 | $112,280 |
| 2018 | $3,398 | $107,800 | $13,200 | $94,600 |
| 2016 | $3,264 | $100,480 | $13,200 | $87,280 |
| 2015 | $2,934 | $84,360 | $12,000 | $72,360 |
| 2014 | -- | $84,360 | $12,000 | $72,360 |
Source: Public Records
Map
Nearby Homes
- 1894 Gray Gables Way
- 3965 Hamilton View Way
- 1682 Mineral Springs Rd
- 1614 Summersweet Ln
- 3925 Greenside Ct
- 3905 Greenside Ct
- 4095 Greenside Ct
- 3078 Turning Creek Trail
- 3068 Turning Creek Trail
- 2252 Floral Ridge Dr
- 4212 Gold Springs Ln
- 4415 Mulberry Ridge Ln Unit 1
- 1620 Treybyrne Ct
- 1661 Silver Crest Way
- 3520 Millwater Crossing
- 1810 Huntington Hill Trace Unit 1
- 1790 Huntington Hill Trace
- 1815 Huntington Hill Trace
- 1775 Huntington Hill Trace Unit 2
- 1820 Huntington Hill Trace
- 1780 Huntington Hill Trace
- 1770 Huntington Hill Trace
- 1760 Huntington Hill Trace
- 4068 Tiffany Rae Cove
- 4069 Manor Hill Place
- 4079 Manor Hill Place
- 1869 Gray Gables Way Unit 3
- 1830 Huntington Hill Trace Unit 1
- 1879 Gray Gables Way
- 1859 Gray Gables Way
- 4078 Tiffany Rae Cove
- 1839 Gray Gables Way
- 4088 Manor Hill Place
- 1750 Huntington Hill Trace
- 1829 Gray Gables Way