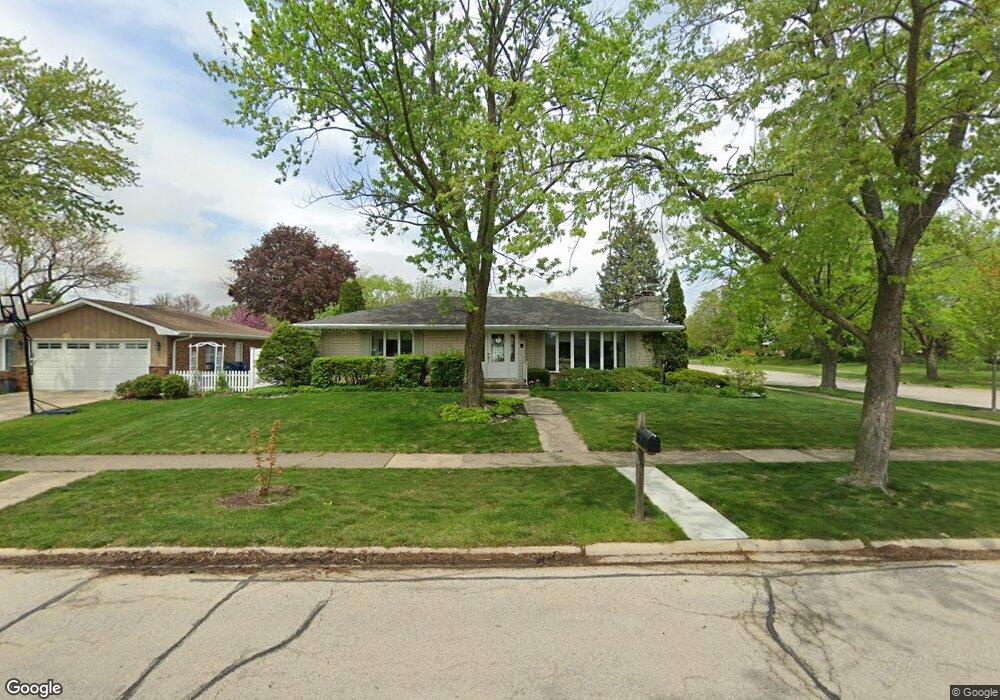
1800 Lynwood St Crest Hill, IL 60403
Estimated Value: $266,196 - $348,000
--
Bed
--
Bath
--
Sq Ft
9,148
Sq Ft Lot
About This Home
This home is located at 1800 Lynwood St, Crest Hill, IL 60403 and is currently estimated at $295,299. 1800 Lynwood St is a home located in Will County with nearby schools including Richland Elementary School, Richland Jr High School, and Lockport Township High School East.
Ownership History
Date
Name
Owned For
Owner Type
Purchase Details
Closed on
Jun 10, 2004
Sold by
Odle Michael S and Odle Mary L
Bought by
Barbic Lawrence L and Barbic Sharon L
Current Estimated Value
Purchase Details
Closed on
Feb 25, 2003
Sold by
Odle Michael Scott and Odle Michael S
Bought by
Odle Michael S and Odle Mary L
Home Financials for this Owner
Home Financials are based on the most recent Mortgage that was taken out on this home.
Original Mortgage
$101,000
Interest Rate
6%
Mortgage Type
Purchase Money Mortgage
Purchase Details
Closed on
Apr 2, 1997
Sold by
Walling Gregory S
Bought by
Odle Michael Scott
Home Financials for this Owner
Home Financials are based on the most recent Mortgage that was taken out on this home.
Original Mortgage
$103,200
Interest Rate
7.37%
Create a Home Valuation Report for This Property
The Home Valuation Report is an in-depth analysis detailing your home's value as well as a comparison with similar homes in the area
Home Values in the Area
Average Home Value in this Area
Purchase History
| Date | Buyer | Sale Price | Title Company |
|---|---|---|---|
| Barbic Lawrence L | $180,000 | Chicago Title Insurance Comp | |
| Odle Michael S | -- | First American | |
| Odle Michael Scott | $129,000 | Attorneys Title Guaranty Fun |
Source: Public Records
Mortgage History
| Date | Status | Borrower | Loan Amount |
|---|---|---|---|
| Previous Owner | Odle Michael S | $101,000 | |
| Previous Owner | Odle Michael Scott | $103,200 |
Source: Public Records
Tax History Compared to Growth
Tax History
| Year | Tax Paid | Tax Assessment Tax Assessment Total Assessment is a certain percentage of the fair market value that is determined by local assessors to be the total taxable value of land and additions on the property. | Land | Improvement |
|---|---|---|---|---|
| 2024 | $5,820 | $88,098 | $23,165 | $64,933 |
| 2023 | $5,820 | $79,089 | $20,796 | $58,293 |
| 2022 | $4,954 | $68,845 | $18,102 | $50,743 |
| 2021 | $4,657 | $64,698 | $17,012 | $47,686 |
| 2020 | $4,512 | $62,571 | $16,453 | $46,118 |
| 2019 | $4,240 | $59,309 | $15,595 | $43,714 |
| 2018 | $3,862 | $53,759 | $14,136 | $39,623 |
| 2017 | $3,617 | $50,750 | $13,345 | $37,405 |
| 2016 | $3,425 | $47,563 | $12,507 | $35,056 |
| 2015 | $3,196 | $45,255 | $11,900 | $33,355 |
| 2014 | $3,196 | $43,100 | $11,333 | $31,767 |
| 2013 | $3,196 | $44,433 | $11,684 | $32,749 |
Source: Public Records
Map
Nearby Homes
- 0 Essington & Ingalls Rd Unit MRD12400228
- 2153 Sandhill Ct
- 2151 Sandhill Ct
- 2150 Sandhill Ct
- 1824 Plainfield Rd
- 2034 Manico Ct Unit 200
- 2034 Manico Ct Unit 101
- LOTS 4 & 5 Plainfield Rd
- 1429 Berta Dr Unit 2W
- 1400 Berta Dr
- 1804 Willow Circle Dr Unit D
- 2300 Greengold St
- 1339 Harvest Dr
- 1310 Harvest Dr
- 1694 Willow Circle Dr Unit B
- Vacant Heiden Ave
- 1822 Barthelone Ave
- 2351 Caton Farm Rd
- 17104 Weber Rd
- 1616 Heiden Ave
- 1804 Lynwood St
- 1801 Lincoln Ave
- 1805 Lincoln Ave
- 1808 Lynwood St Unit 3
- 1733 Lincoln Ave
- 1737 Lynwood St
- 1809 Lincoln Ave
- 1733 Lynwood St
- 1724 Lynwood St
- 1801 Lynwood St
- 1812 Lynwood St
- 1729 Lincoln Ave
- 1813 Lincoln Ave
- 1729 Lynwood St
- 2108 Crestwood Dr
- 2104 Crestwood Dr
- 1800 Lincoln Ave
- 1804 Lincoln Ave
- 1805 Lynwood St
- 1732 Lincoln Ave