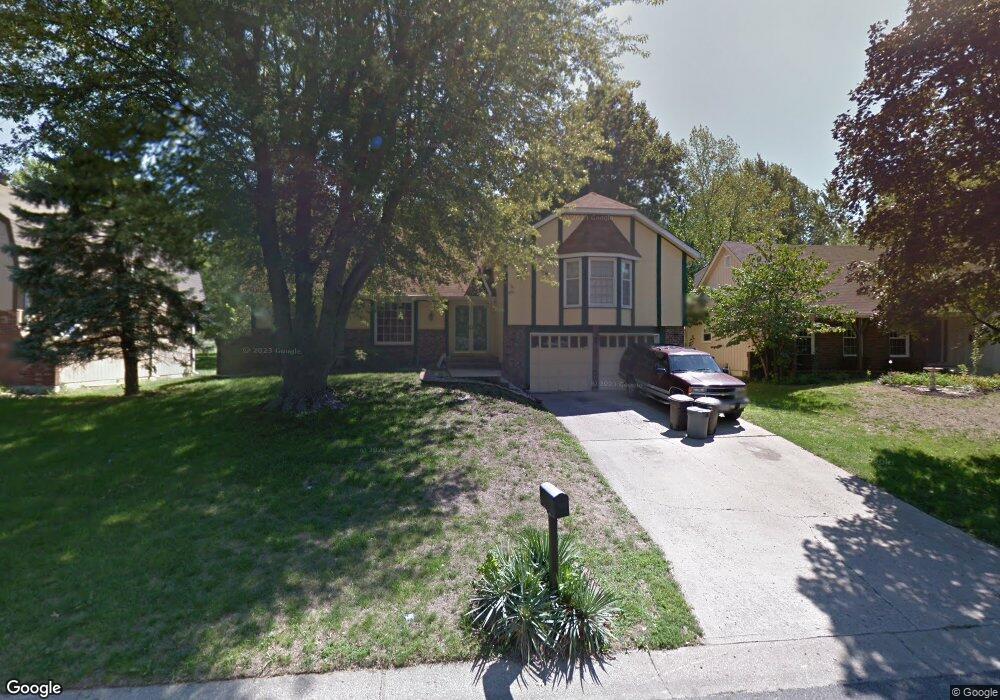
1800 NW Willowbrook Dr Blue Springs, MO 64015
Estimated Value: $330,000 - $343,000
4
Beds
3
Baths
2,275
Sq Ft
$148/Sq Ft
Est. Value
About This Home
This home is located at 1800 NW Willowbrook Dr, Blue Springs, MO 64015 and is currently estimated at $337,232, approximately $148 per square foot. 1800 NW Willowbrook Dr is a home located in Jackson County with nearby schools including Thomas J. Ultican Elementary School, Paul Kinder Middle School, and Blue Springs High School.
Ownership History
Date
Name
Owned For
Owner Type
Purchase Details
Closed on
Mar 10, 2004
Sold by
Hill Jenelle C
Bought by
Hill Jenelle C and Coleman Lew A
Current Estimated Value
Purchase Details
Closed on
Dec 13, 2002
Sold by
Winningham Richard D and Winningham Deborah S
Bought by
Hill Jenelle C
Home Financials for this Owner
Home Financials are based on the most recent Mortgage that was taken out on this home.
Original Mortgage
$145,754
Outstanding Balance
$61,752
Interest Rate
6.05%
Mortgage Type
Purchase Money Mortgage
Estimated Equity
$275,480
Purchase Details
Closed on
May 8, 1997
Sold by
Knust Robert J and Knust Debra D
Bought by
Winningham Richard D and Winningham Deborah S
Home Financials for this Owner
Home Financials are based on the most recent Mortgage that was taken out on this home.
Original Mortgage
$106,365
Interest Rate
7.97%
Mortgage Type
FHA
Create a Home Valuation Report for This Property
The Home Valuation Report is an in-depth analysis detailing your home's value as well as a comparison with similar homes in the area
Home Values in the Area
Average Home Value in this Area
Purchase History
| Date | Buyer | Sale Price | Title Company |
|---|---|---|---|
| Hill Jenelle C | -- | -- | |
| Hill Jenelle C | -- | Kansas City Title | |
| Winningham Richard D | -- | Stewart Title |
Source: Public Records
Mortgage History
| Date | Status | Borrower | Loan Amount |
|---|---|---|---|
| Open | Hill Jenelle C | $145,754 | |
| Previous Owner | Winningham Richard D | $106,365 |
Source: Public Records
Tax History Compared to Growth
Tax History
| Year | Tax Paid | Tax Assessment Tax Assessment Total Assessment is a certain percentage of the fair market value that is determined by local assessors to be the total taxable value of land and additions on the property. | Land | Improvement |
|---|---|---|---|---|
| 2025 | $4,497 | $49,751 | $6,249 | $43,502 |
| 2024 | $4,410 | $55,115 | $6,192 | $48,923 |
| 2023 | $4,410 | $55,116 | $5,689 | $49,427 |
| 2022 | $3,406 | $37,620 | $5,444 | $32,176 |
| 2021 | $3,403 | $37,620 | $5,444 | $32,176 |
| 2020 | $3,045 | $34,236 | $5,444 | $28,792 |
| 2019 | $2,943 | $34,236 | $5,444 | $28,792 |
| 2018 | $2,636 | $29,509 | $3,133 | $26,376 |
| 2017 | $2,537 | $29,509 | $3,133 | $26,376 |
| 2016 | $2,537 | $28,481 | $2,945 | $25,536 |
| 2014 | $2,522 | $28,218 | $2,935 | $25,283 |
Source: Public Records
Map
Nearby Homes
- 503 NW 15th St
- 305 NW 17th St
- 1109 NW B St
- 1109 NW Mock Ave
- 2317 NW Kensington Ct
- 804 NW Maynard St
- 2508 NW Castle Dr
- 1705 SW Walnut St
- 2000 SW Smith St
- 913 NW Camelot Ct
- 1389 NW Jefferson Ct
- 804 NW North Summit Cir
- 401 SW 18th St
- 516 NW Mill Ct
- 1400 NW Deer Run Trail
- 723 NW 6th Street Terrace
- 505 SW 18th St
- 2804 NW Kingsridge Dr
- 318 SW 10th St
- 216 SW 26th St
- 1708 NW Willowbrook Dr
- 1804 NW Willowbrook Dr
- 1808 NW Willowbrook Dr
- 1704 NW Willowbrook Dr
- 1801 NW Willowbrook Dr
- 1707 NW Willowbrook Dr
- 1700 NW Willowbrook Dr
- 1805 NW Willowbrook Dr
- 705 NW 18th St
- 1608 NW Willowbrook Dr
- 708 NW 18th St
- 707 NW 16th St
- 1809 NW Willowbrook Dr
- 711 NW 16th St
- 709 NW 18th St
- 711 NW 16th St
- 514 NW Willowbrook Ct
- 1701 NW Willowbrook Dr
- 1604 NW Willowbrook Dr
- 804 NW 18th St