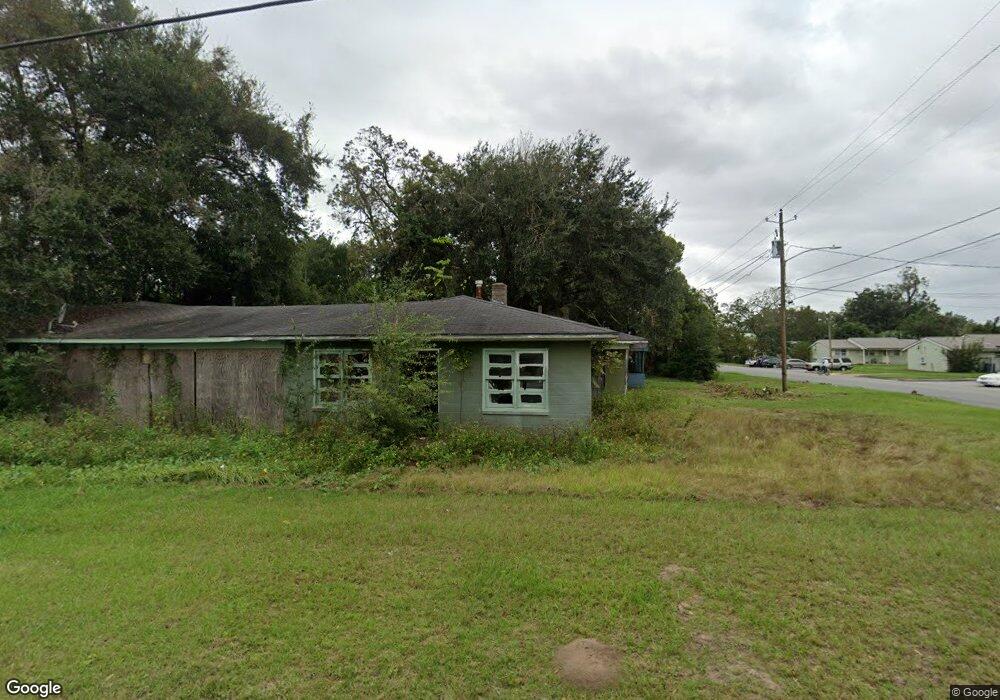
1800 Q St Brunswick, GA 31520
Town Commons NeighborhoodEstimated Value: $190,000 - $245,000
4
Beds
3
Baths
2,254
Sq Ft
$93/Sq Ft
Est. Value
About This Home
This home is located at 1800 Q St, Brunswick, GA 31520 and is currently estimated at $210,053, approximately $93 per square foot. 1800 Q St is a home located in Glynn County with nearby schools including Burroughs-Molette Elementary School, Risley Middle School, and Brunswick High School.
Ownership History
Date
Name
Owned For
Owner Type
Purchase Details
Closed on
Nov 15, 2024
Sold by
A & P Empire Llc
Bought by
Dawson Thomas and Dawson Thomas
Current Estimated Value
Purchase Details
Closed on
Oct 4, 2024
Sold by
Fox Stephanie Dawson
Bought by
Maximizing Purpose Llc and Reid James Albert
Purchase Details
Closed on
Oct 2, 2024
Sold by
Dawson Fox Stephanie
Bought by
Maximizing Purpose Llc
Purchase Details
Closed on
Jun 30, 2024
Sold by
Dawson Darrell R
Bought by
Dawson Fox Stefanie and Fox Stefanie Dawson
Purchase Details
Closed on
May 24, 2024
Sold by
Dawson Thomas
Bought by
Dawson Fox Stefanie and Fox Stefanie Dawson
Purchase Details
Closed on
Oct 3, 2023
Sold by
Brunswick City
Bought by
A & P Empire Llc
Purchase Details
Closed on
Jan 29, 2013
Sold by
Budd Roger M
Bought by
Dawson Thomas
Purchase Details
Closed on
Jan 3, 2012
Bought by
Budd Roger
Create a Home Valuation Report for This Property
The Home Valuation Report is an in-depth analysis detailing your home's value as well as a comparison with similar homes in the area
Home Values in the Area
Average Home Value in this Area
Purchase History
| Date | Buyer | Sale Price | Title Company |
|---|---|---|---|
| Dawson Thomas | -- | -- | |
| Maximizing Purpose Llc | -- | -- | |
| Maximizing Purpose Llc | -- | -- | |
| Dawson Fox Stefanie | -- | -- | |
| Dawson Fox Stefanie | -- | -- | |
| A & P Empire Llc | $40,000 | -- | |
| Dawson Thomas | $5,741 | -- | |
| Budd Roger | -- | -- |
Source: Public Records
Tax History Compared to Growth
Tax History
| Year | Tax Paid | Tax Assessment Tax Assessment Total Assessment is a certain percentage of the fair market value that is determined by local assessors to be the total taxable value of land and additions on the property. | Land | Improvement |
|---|---|---|---|---|
| 2025 | $1,023 | $48,680 | $4,920 | $43,760 |
| 2024 | $997 | $47,440 | $3,680 | $43,760 |
| 2023 | $1,191 | $33,440 | $3,680 | $29,760 |
| 2022 | $955 | $26,320 | $2,480 | $23,840 |
| 2021 | $655 | $17,160 | $2,480 | $14,680 |
| 2020 | $717 | $17,160 | $2,480 | $14,680 |
| 2019 | $381 | $17,160 | $2,480 | $14,680 |
| 2018 | $476 | $19,800 | $3,680 | $16,120 |
| 2017 | $739 | $19,800 | $3,680 | $16,120 |
| 2016 | $704 | $19,800 | $3,680 | $16,120 |
| 2015 | $706 | $19,800 | $3,680 | $16,120 |
| 2014 | $706 | $19,800 | $3,680 | $16,120 |
Source: Public Records
Map
Nearby Homes
- 2626 Gordon St
- 2005 R St
- 2611 Albany St
- 2918 Wolfe St
- 2308 Albany St
- 2314 Wolfe St
- 608 Q St
- 602 Q St
- 3215 Wesley Ave
- 3314 N Cleburne St
- 3107 Prim Place
- 3310 Franklin Ave
- 3404 Lee St
- 3119 Treville Ave
- 2329 Reynolds St
- 2806 Sherwood Dr
- 1009 K St
- 2806 & 2812 Evergreen Rd
- 3420 Brailsford Ave
- 2123 Ellis St
- 2624 Gordon St
- 2627 Johnston St
- 1805 Q St
- 2620 Gordon St
- 2620 Gordon St Unit 2622
- 1809 Q St
- 2619 Johnston St
- 2618 Gordon St
- 1705 Q St
- 2705 Johnston St
- 2615 Johnston St
- 2628 Johnston St
- 2622 Johnston St
- 2712 Gordon St
- 1907 Q St
- 2711 Johnston St
- 1701 Q St
- 2616 Johnston St
- 2607 Johnston St
- 2706 Johnston St