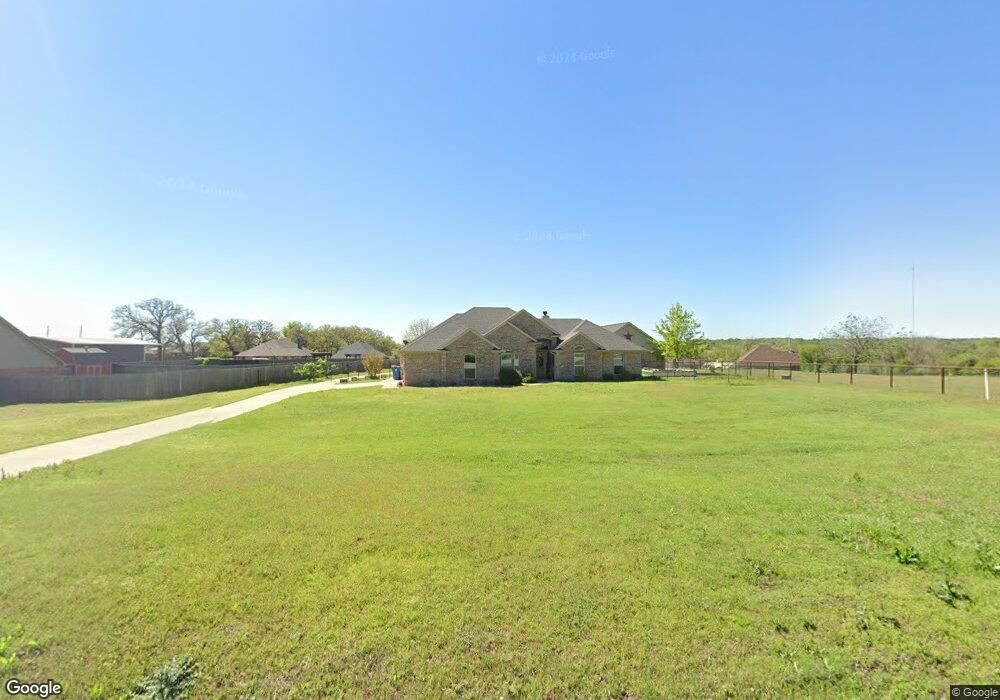
1800 Upper Denton Rd Weatherford, TX 76085
Estimated Value: $477,000 - $607,000
4
Beds
2
Baths
2,413
Sq Ft
$222/Sq Ft
Est. Value
About This Home
This home is located at 1800 Upper Denton Rd, Weatherford, TX 76085 and is currently estimated at $536,084, approximately $222 per square foot. 1800 Upper Denton Rd is a home located in Parker County with nearby schools including Crockett Elementary School, Tison Middle School, and Weatherford High School.
Ownership History
Date
Name
Owned For
Owner Type
Purchase Details
Closed on
Jun 14, 2017
Sold by
Murrell Debra R and Murphy Michael S
Bought by
Birth Robert W and Birth Nancy R
Current Estimated Value
Purchase Details
Closed on
Jun 11, 2012
Sold by
Montgomery Tracy and Montgomery Rhiannon
Bought by
Birth Robert W and Birth Nancy R
Home Financials for this Owner
Home Financials are based on the most recent Mortgage that was taken out on this home.
Original Mortgage
$192,857
Interest Rate
3.86%
Mortgage Type
New Conventional
Purchase Details
Closed on
Jun 27, 2008
Sold by
Vhi Construction Inc
Bought by
Birth Robert W and Birth Nancy R
Home Financials for this Owner
Home Financials are based on the most recent Mortgage that was taken out on this home.
Original Mortgage
$140,000
Interest Rate
6.05%
Mortgage Type
Purchase Money Mortgage
Create a Home Valuation Report for This Property
The Home Valuation Report is an in-depth analysis detailing your home's value as well as a comparison with similar homes in the area
Home Values in the Area
Average Home Value in this Area
Purchase History
| Date | Buyer | Sale Price | Title Company |
|---|---|---|---|
| Birth Robert W | -- | Providence Title Company | |
| Birth Robert W | -- | -- | |
| Murrell Debra R | -- | Stewart | |
| Birth Robert W | -- | -- | |
| Montgomery Tracy | -- | None Available |
Source: Public Records
Mortgage History
| Date | Status | Borrower | Loan Amount |
|---|---|---|---|
| Previous Owner | Murrell Debra R | $192,857 | |
| Previous Owner | Montgomery Tracy | $140,000 |
Source: Public Records
Tax History Compared to Growth
Tax History
| Year | Tax Paid | Tax Assessment Tax Assessment Total Assessment is a certain percentage of the fair market value that is determined by local assessors to be the total taxable value of land and additions on the property. | Land | Improvement |
|---|---|---|---|---|
| 2025 | $5,072 | $461,833 | -- | -- |
| 2024 | $5,072 | $419,848 | -- | -- |
| 2023 | $5,072 | $381,680 | $0 | $0 |
| 2022 | $6,460 | $346,990 | $40,000 | $306,990 |
| 2021 | $7,004 | $346,990 | $40,000 | $306,990 |
| 2020 | $6,887 | $340,830 | $40,000 | $300,830 |
| 2019 | $6,679 | $340,830 | $40,000 | $300,830 |
| 2018 | $6,104 | $280,610 | $40,000 | $240,610 |
| 2017 | $5,749 | $259,010 | $40,000 | $219,010 |
| 2016 | $5,714 | $257,420 | $33,000 | $224,420 |
| 2015 | $4,801 | $257,420 | $33,000 | $224,420 |
| 2014 | $4,136 | $214,620 | $33,000 | $181,620 |
Source: Public Records
Map
Nearby Homes
- 600 Joyce St
- 209 Ellis Creek Dr
- 150 Ellis Spring Dr
- 313 De la Cruz St
- 2277 Tanglewood St
- 1083 E 1st St
- 2358 Tanglewood St
- 707 Gail Dr
- 719 Gail Dr
- 1211 Van Winkle St
- 801 E 3rd St
- 1609 Dicey Rd
- 101 Meadow Ct
- 817 E 2nd St
- 2113-A Dicey Rd
- 249 Wandering Ln
- 506 E 5th St
- 1008 Van Winkle St
- 505 E 4th St
- 1014 King St
- 1810 Upper Denton Rd
- 104 Smokey Branch
- 1803 Upper Denton Rd
- 100 Smokey Branch
- 1790 Upper Denton Rd
- 108 Smokey Branch
- 112 Smokey Branch
- 1833 Upper Denton Rd
- 113 Smokey Branch
- 107 Smokey Branch
- 000A Smokey Branch
- 1891 N Bend Rd
- 1891 N Bend Rd
- 116 Smokey Terrace Ln
- TBD C-D Smokey Terrace Ln
- 119 Smokey Branch
- 1911 Upper Denton Rd
- 122 Smokey Terrace Ln
- 107 Smokey Terrace Ln
- 115 Smokey Terrace Ln