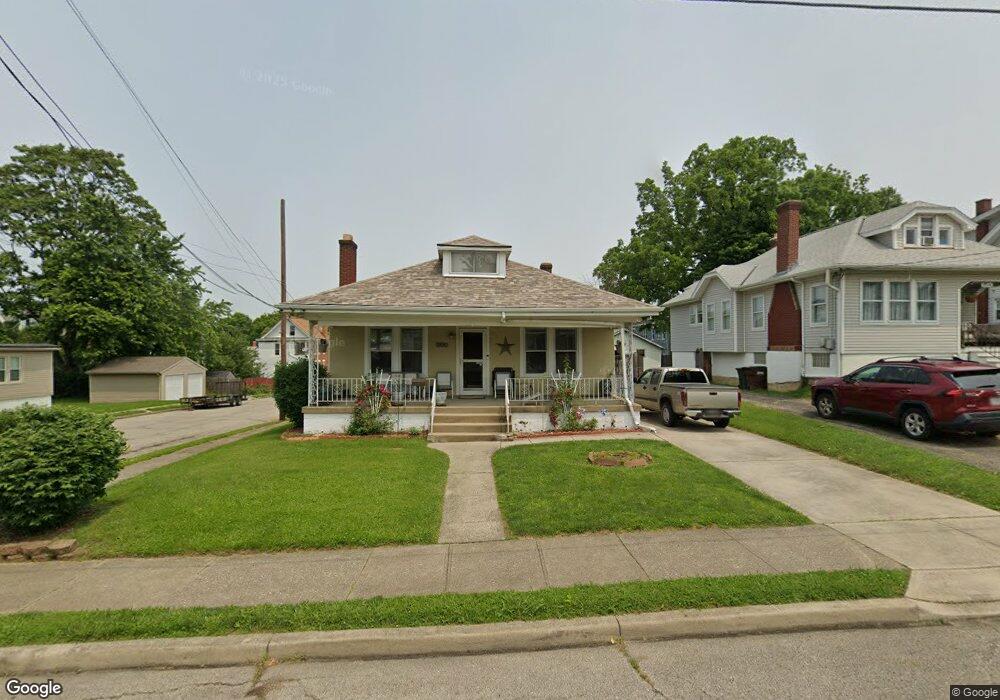
1800 Weyer Ave Cincinnati, OH 45212
Estimated Value: $199,292 - $224,000
2
Beds
1
Bath
936
Sq Ft
$227/Sq Ft
Est. Value
About This Home
This home is located at 1800 Weyer Ave, Cincinnati, OH 45212 and is currently estimated at $212,073, approximately $226 per square foot. 1800 Weyer Ave is a home located in Hamilton County with nearby schools including Norwood High School, Cornerstone Christian Academy, and Xavier University Montessori Lab School.
Ownership History
Date
Name
Owned For
Owner Type
Purchase Details
Closed on
Oct 6, 2003
Sold by
Jones Mary Ann
Bought by
Harris Carol S
Current Estimated Value
Home Financials for this Owner
Home Financials are based on the most recent Mortgage that was taken out on this home.
Original Mortgage
$83,300
Outstanding Balance
$38,926
Interest Rate
6.23%
Mortgage Type
Unknown
Estimated Equity
$173,147
Purchase Details
Closed on
Sep 19, 2003
Sold by
Estate Of Eva Mae Mcwhorter
Bought by
Jones Mary Ann
Home Financials for this Owner
Home Financials are based on the most recent Mortgage that was taken out on this home.
Original Mortgage
$83,300
Outstanding Balance
$38,926
Interest Rate
6.23%
Mortgage Type
Unknown
Estimated Equity
$173,147
Purchase Details
Closed on
Mar 12, 1998
Sold by
Mcwhorter William B and Mcwhorter Eva Mae
Bought by
Mcwhorter Eva Mae
Purchase Details
Closed on
Sep 1, 1994
Sold by
Mcwhorter Eva Mae
Bought by
Mcwhorter William B and Mcwhorter Eva Mae
Create a Home Valuation Report for This Property
The Home Valuation Report is an in-depth analysis detailing your home's value as well as a comparison with similar homes in the area
Home Values in the Area
Average Home Value in this Area
Purchase History
| Date | Buyer | Sale Price | Title Company |
|---|---|---|---|
| Harris Carol S | $98,000 | Advanced Land Title Agency L | |
| Jones Mary Ann | -- | -- | |
| Mcwhorter Eva Mae | -- | -- | |
| Mcwhorter William B | -- | -- | |
| Mcwhorter William B | -- | -- |
Source: Public Records
Mortgage History
| Date | Status | Borrower | Loan Amount |
|---|---|---|---|
| Open | Harris Carol S | $83,300 |
Source: Public Records
Tax History Compared to Growth
Tax History
| Year | Tax Paid | Tax Assessment Tax Assessment Total Assessment is a certain percentage of the fair market value that is determined by local assessors to be the total taxable value of land and additions on the property. | Land | Improvement |
|---|---|---|---|---|
| 2024 | $1,622 | $42,270 | $11,613 | $30,657 |
| 2023 | $2,271 | $42,270 | $11,613 | $30,657 |
| 2022 | $1,809 | $28,329 | $7,798 | $20,531 |
| 2021 | $1,787 | $28,329 | $7,798 | $20,531 |
| 2020 | $1,748 | $28,329 | $7,798 | $20,531 |
| 2019 | $1,669 | $24,850 | $6,839 | $18,011 |
| 2018 | $1,670 | $24,850 | $6,839 | $18,011 |
| 2017 | $1,601 | $24,850 | $6,839 | $18,011 |
| 2016 | $1,635 | $24,291 | $6,430 | $17,861 |
| 2015 | $1,442 | $24,291 | $6,430 | $17,861 |
| 2014 | $1,439 | $24,291 | $6,430 | $17,861 |
| 2013 | $1,514 | $25,841 | $6,839 | $19,002 |
Source: Public Records
Map
Nearby Homes
- 1803 Courtland Ave
- 1810 Lincoln Ave
- 4205 Lowry Ave
- 1841 Mills Ave
- 1701 Sherman Ave
- 1817 Sherman Ave
- 1835 Sherman Ave
- 4627 Mcneil Ave
- 1901 Sherman Ave
- 4639 Carter Ave
- 4108 Ivanhoe Ave
- 4028 Ledgewood Dr
- 4635 Baker St
- 1768 Williams Ave
- 1915 Waverly Ave
- 2012 Lawrence Ave
- 1915 Maple Ave
- 4049 Victory Pkwy
- 1821 Williams Ave
- 1937 Maple Ave
- 1804 Weyer Ave
- 1762 Weyer Ave
- 1810 Weyer Ave
- 1805 Courtland Ave
- 1760 Weyer Ave
- 1814 Weyer Ave
- 1809 Courtland Ave
- 1771 Courtland Ave
- 1801 Weyer Ave
- 1811 Courtland Ave
- 1803 Weyer Ave
- 4239 Bell St
- 1758 Weyer Ave
- 1815 Courtland Ave
- 1816 Weyer Ave
- 1765 Courtland Ave
- 4237 Bell St
- 1809 Weyer Ave
- 1756 Weyer Ave
- 4234 Bell St