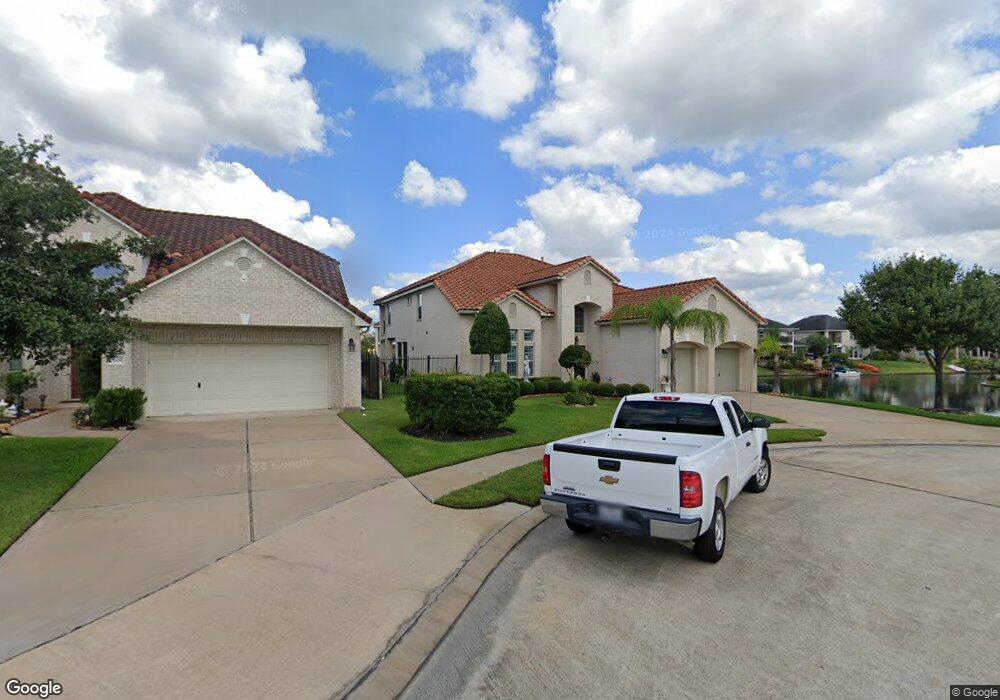
18002 Darling Point Ct Cypress, TX 77429
Estimated Value: $523,000 - $565,000
4
Beds
4
Baths
3,872
Sq Ft
$142/Sq Ft
Est. Value
About This Home
This home is located at 18002 Darling Point Ct, Cypress, TX 77429 and is currently estimated at $551,578, approximately $142 per square foot. 18002 Darling Point Ct is a home located in Harris County with nearby schools including Farney Elementary School, Goodson Middle, and Cypress Woods High School.
Ownership History
Date
Name
Owned For
Owner Type
Purchase Details
Closed on
Sep 18, 2018
Sold by
Glasgow Larry M and Glasgow Carole D
Bought by
Nguyen Quang Duy and Nguyen Lily Dao
Current Estimated Value
Home Financials for this Owner
Home Financials are based on the most recent Mortgage that was taken out on this home.
Original Mortgage
$320,000
Outstanding Balance
$197,048
Interest Rate
4.5%
Mortgage Type
New Conventional
Estimated Equity
$354,530
Purchase Details
Closed on
Dec 28, 2005
Sold by
Us Bank Na
Bought by
Glasgow Larry M and Glasgow Carole D
Purchase Details
Closed on
Jun 7, 2005
Sold by
Campbell Eric
Bought by
Us Bank Na
Purchase Details
Closed on
Sep 9, 2004
Sold by
Legend Classic Homes Ltd
Bought by
Campbell Eric
Home Financials for this Owner
Home Financials are based on the most recent Mortgage that was taken out on this home.
Original Mortgage
$391,543
Interest Rate
9.7%
Mortgage Type
Purchase Money Mortgage
Create a Home Valuation Report for This Property
The Home Valuation Report is an in-depth analysis detailing your home's value as well as a comparison with similar homes in the area
Home Values in the Area
Average Home Value in this Area
Purchase History
| Date | Buyer | Sale Price | Title Company |
|---|---|---|---|
| Nguyen Quang Duy | -- | Providence Title Company | |
| Glasgow Larry M | -- | Fidelity National Title | |
| Us Bank Na | $345,960 | -- | |
| Campbell Eric | -- | Stewart Title Houston Div | |
| Legend Classic Homes Ltd | -- | Stewart Title Houston Div |
Source: Public Records
Mortgage History
| Date | Status | Borrower | Loan Amount |
|---|---|---|---|
| Open | Nguyen Quang Duy | $320,000 | |
| Previous Owner | Campbell Eric | $391,543 |
Source: Public Records
Tax History Compared to Growth
Tax History
| Year | Tax Paid | Tax Assessment Tax Assessment Total Assessment is a certain percentage of the fair market value that is determined by local assessors to be the total taxable value of land and additions on the property. | Land | Improvement |
|---|---|---|---|---|
| 2025 | $8,865 | $531,208 | $88,662 | $442,546 |
| 2024 | $8,865 | $503,659 | $88,662 | $414,997 |
| 2023 | $8,865 | $520,321 | $88,662 | $431,659 |
| 2022 | $10,636 | $482,333 | $77,088 | $405,245 |
| 2021 | $10,315 | $373,595 | $77,088 | $296,507 |
| 2020 | $10,651 | $370,577 | $77,088 | $293,489 |
| 2019 | $10,782 | $361,112 | $77,088 | $284,024 |
| 2018 | $2,117 | $356,049 | $77,088 | $278,961 |
| 2017 | $10,815 | $359,747 | $77,088 | $282,659 |
| 2016 | $10,899 | $363,388 | $61,104 | $302,284 |
| 2015 | $5,478 | $358,292 | $61,104 | $297,188 |
| 2014 | $5,478 | $327,291 | $61,104 | $266,187 |
Source: Public Records
Map
Nearby Homes
- 17922 Harbour Bridge Point Dr
- 17931 Sugarloaf Bay Dr
- 17926 Sugarloaf Bay Dr
- 18103 Blues Point Dr
- 18103 Double Bay Rd
- 17910 Cypress Valley Ln
- 14803 Opera House Row Dr
- 15026 Magnoliabough Place
- 14727 Arbor Trace Ct
- 15011 Magnoliabough Place
- 18306 Juniper Creek Ln
- 17631 Huffmeister Rd
- 14639 Cypress Cottage Ct
- 17862 Camp Cove Dr
- 14706 Emerald Cypress Ln
- 17515 Cypress Orchard Ln
- 18318 Maple Mill Dr
- 18510 Lodgepole Pine St
- 15430 Elm Leaf Place
- 15506 Elm Leaf Place
- 18006 Darling Point Ct
- 18010 Darling Point Ct
- 18014 Darling Point Ct
- 18011 Harbour Bridge Point Dr
- 18007 Harbour Bridge Point Dr
- 18003 Darling Point Ct
- 18015 Harbour Bridge Point Dr
- 17930 Avalon Point Ct
- 18007 Darling Point Ct
- 18003 Harbour Bridge Point Dr
- 18019 Harbour Bridge Point Dr
- 18011 Darling Point Ct
- 18018 Darling Point Ct
- 18023 Harbour Bridge Point Dr
- 18015 Darling Point Ct
- 17926 Avalon Point Ct
- 18022 Darling Point Ct
- 17927 Harbour Bridge Point Dr
- 18019 Darling Point Ct
- 18027 Harbour Bridge Point Dr