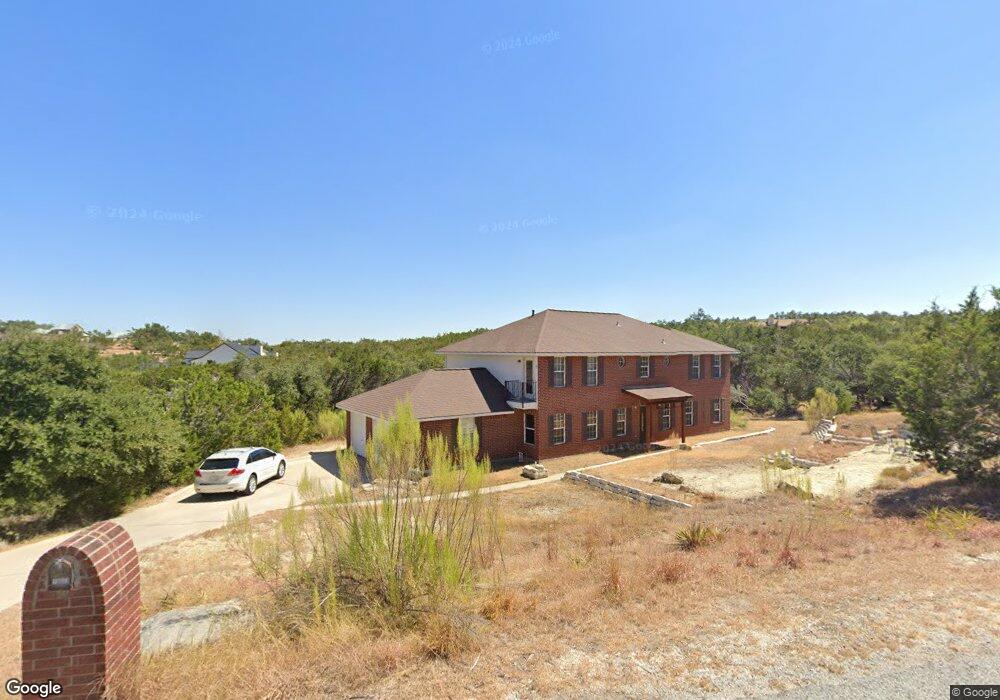
18003 Fawns Crossing Dripping Springs, TX 78620
Hamilton Pool NeighborhoodEstimated Value: $764,000 - $933,000
4
Beds
3
Baths
2,833
Sq Ft
$292/Sq Ft
Est. Value
About This Home
This home is located at 18003 Fawns Crossing, Dripping Springs, TX 78620 and is currently estimated at $827,015, approximately $291 per square foot. 18003 Fawns Crossing is a home located in Hays County with nearby schools including Dripping Springs Middle School and Dripping Springs High School.
Ownership History
Date
Name
Owned For
Owner Type
Purchase Details
Closed on
Sep 18, 2008
Sold by
Fannie Mae
Bought by
Stonescu Julian
Current Estimated Value
Home Financials for this Owner
Home Financials are based on the most recent Mortgage that was taken out on this home.
Original Mortgage
$225,888
Outstanding Balance
$150,606
Interest Rate
6.57%
Mortgage Type
FHA
Estimated Equity
$676,409
Purchase Details
Closed on
May 6, 2008
Sold by
Wolniewitz Hannah
Bought by
Stonescu Julian
Purchase Details
Closed on
Sep 29, 2006
Sold by
Martin Josef T and Martin Martha L
Bought by
Wolniewitz Hannah
Home Financials for this Owner
Home Financials are based on the most recent Mortgage that was taken out on this home.
Original Mortgage
$247,500
Interest Rate
6.51%
Mortgage Type
Purchase Money Mortgage
Create a Home Valuation Report for This Property
The Home Valuation Report is an in-depth analysis detailing your home's value as well as a comparison with similar homes in the area
Home Values in the Area
Average Home Value in this Area
Purchase History
| Date | Buyer | Sale Price | Title Company |
|---|---|---|---|
| Stonescu Julian | -- | Independence Title Co | |
| Stonescu Julian | -- | -- | |
| Federal National Mortgage Association | $270,915 | None Available | |
| Wolniewitz Hannah | -- | None Available |
Source: Public Records
Mortgage History
| Date | Status | Borrower | Loan Amount |
|---|---|---|---|
| Open | Stonescu Julian | $225,888 | |
| Previous Owner | Wolniewitz Hannah | $247,500 |
Source: Public Records
Tax History Compared to Growth
Tax History
| Year | Tax Paid | Tax Assessment Tax Assessment Total Assessment is a certain percentage of the fair market value that is determined by local assessors to be the total taxable value of land and additions on the property. | Land | Improvement |
|---|---|---|---|---|
| 2025 | $5,176 | $642,690 | -- | -- |
| 2024 | $5,176 | $584,264 | $353,150 | $417,120 |
| 2023 | $8,020 | $531,149 | $353,150 | $572,520 |
| 2022 | $8,236 | $482,863 | $180,020 | $524,400 |
| 2021 | $8,213 | $438,966 | $135,010 | $305,730 |
| 2020 | $7,111 | $402,050 | $113,410 | $297,920 |
| 2019 | $7,537 | $365,500 | $90,360 | $275,140 |
| 2018 | $7,253 | $349,740 | $90,360 | $259,380 |
| 2017 | $6,668 | $319,140 | $66,930 | $252,210 |
| 2016 | $6,262 | $299,680 | $65,590 | $234,090 |
| 2015 | $5,602 | $286,900 | $65,590 | $221,310 |
Source: Public Records
Map
Nearby Homes
- 10978 W Cave Blvd
- 0 Westward Look
- 17811 Mason Dixon Cir
- 17912 Turkey Trot Trail
- 17517 Panorama Dr
- 10624 Lake Park Dr
- 621 Deer Creek Cir
- 17503 Panorama Dr
- 10627 Lake Park Dr
- 17837 Panorama Dr
- 10511 Lake Park Dr
- 10722 Lake Park Dr
- 18220 Shepherds Corral
- 17621 Panorama Dr
- 10806 Glenview Cir
- 17601 Lake Shore Dr
- 17503 Lake Shore Dr
- 17610 Village Dr
- 10215 Hill Country Skyline
- 10105 Twin Lake Loop
- 17901 Fawns Crossing
- 10972 W Cave Blvd
- 18004 Fawns Crossing
- 17900 Fawns Crossing
- 00000 Fawns Crossing
- 18008 Fawns Crossing
- 18011 Fawns Crossing
- 18019 Montecito Blvd
- 16308 Paddlefish Way
- 17808 Westward Look
- 17900 Westward Look
- 10961 W Cave Blvd
- 18101 Montecito Blvd
- 18010 Fawns Crossing
- 17814 Mason Dixon Cir
- 10960 W Cave Blvd
- 10960 W Cave Blvd
- 18017 Fawns Crossing
- 17910 Westward Look
- 10975 W Cave Blvd