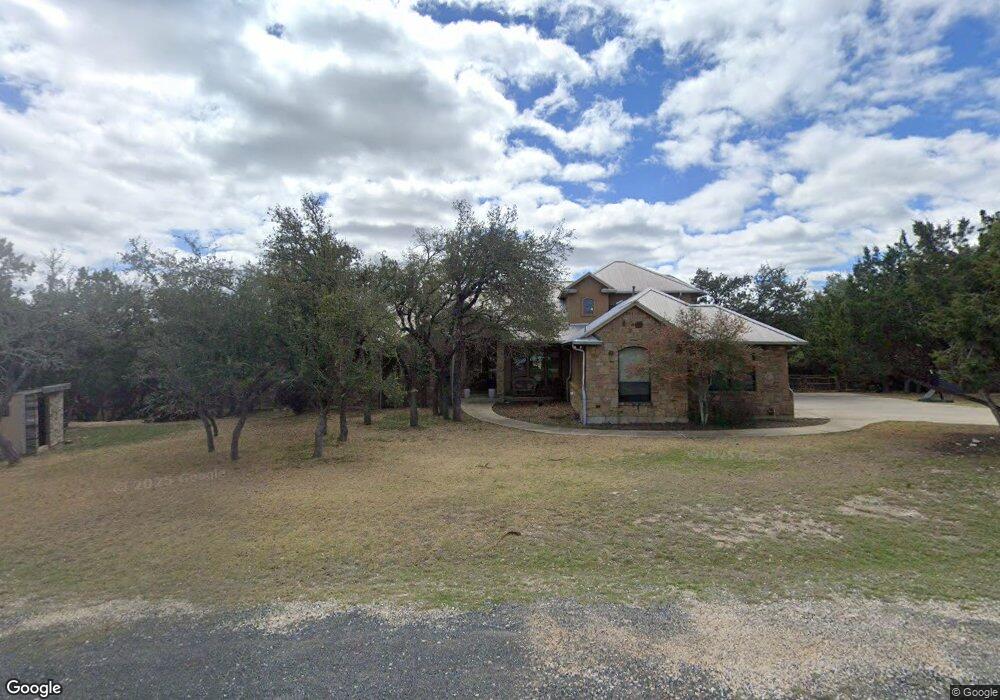
18005 Hideaway Cove Dripping Springs, TX 78620
Hamilton Pool NeighborhoodEstimated Value: $860,000 - $938,000
5
Beds
4
Baths
3,447
Sq Ft
$262/Sq Ft
Est. Value
About This Home
This home is located at 18005 Hideaway Cove, Dripping Springs, TX 78620 and is currently estimated at $903,021, approximately $261 per square foot. 18005 Hideaway Cove is a home located in Travis County with nearby schools including Bee Cave Elementary School, Bee Cave Middle School, and Lake Travis High School.
Ownership History
Date
Name
Owned For
Owner Type
Purchase Details
Closed on
Apr 16, 2010
Sold by
Nmd Properties Llc
Bought by
Myers Bruce A and Myers Jessica L
Current Estimated Value
Home Financials for this Owner
Home Financials are based on the most recent Mortgage that was taken out on this home.
Original Mortgage
$307,200
Outstanding Balance
$203,385
Interest Rate
4.88%
Mortgage Type
New Conventional
Estimated Equity
$699,636
Purchase Details
Closed on
Sep 2, 2009
Sold by
Dailey Stephen
Bought by
Nmo Properties
Purchase Details
Closed on
Oct 27, 2006
Sold by
Lentz Marcus and Lentz Barbara
Bought by
Dailey Stephen
Home Financials for this Owner
Home Financials are based on the most recent Mortgage that was taken out on this home.
Original Mortgage
$384,000
Interest Rate
6.41%
Mortgage Type
Purchase Money Mortgage
Purchase Details
Closed on
Aug 26, 2004
Sold by
Maduzia David Wayne
Bought by
Lentz Marcus and Lentz Barbara
Home Financials for this Owner
Home Financials are based on the most recent Mortgage that was taken out on this home.
Original Mortgage
$410,602
Interest Rate
6%
Mortgage Type
Purchase Money Mortgage
Create a Home Valuation Report for This Property
The Home Valuation Report is an in-depth analysis detailing your home's value as well as a comparison with similar homes in the area
Home Values in the Area
Average Home Value in this Area
Purchase History
| Date | Buyer | Sale Price | Title Company |
|---|---|---|---|
| Myers Bruce A | -- | Itc | |
| Nmo Properties | -- | None Available | |
| Dailey Stephen | -- | First American Title | |
| Lentz Marcus | -- | -- |
Source: Public Records
Mortgage History
| Date | Status | Borrower | Loan Amount |
|---|---|---|---|
| Open | Myers Bruce A | $307,200 | |
| Previous Owner | Dailey Stephen | $384,000 | |
| Previous Owner | Lentz Marcus | $410,602 |
Source: Public Records
Tax History Compared to Growth
Tax History
| Year | Tax Paid | Tax Assessment Tax Assessment Total Assessment is a certain percentage of the fair market value that is determined by local assessors to be the total taxable value of land and additions on the property. | Land | Improvement |
|---|---|---|---|---|
| 2025 | $9,268 | $758,675 | $398,200 | $360,475 |
| 2023 | $8,065 | $721,535 | $0 | $0 |
| 2022 | $11,254 | $655,941 | $0 | $0 |
| 2021 | $10,729 | $596,310 | $89,595 | $542,805 |
| 2020 | $10,552 | $551,800 | $89,595 | $462,205 |
| 2018 | $10,723 | $540,519 | $89,595 | $450,924 |
| 2017 | $10,820 | $540,519 | $89,595 | $450,924 |
| 2016 | $10,076 | $503,336 | $59,730 | $443,606 |
| 2015 | $7,181 | $480,528 | $59,730 | $434,536 |
| 2014 | $7,181 | $436,844 | $0 | $0 |
Source: Public Records
Map
Nearby Homes
- 18220 Shepherds Corral
- 17912 Turkey Trot Trail
- 10215 Hill Country Skyline
- 10105 Twin Lake Loop
- 17811 Mason Dixon Cir
- 10103 Twin Lake Loop
- 10101 Twin Lake Loop
- 10113 Longhorn Skyway
- 10115 Longhorn Skyway
- 10978 W Cave Blvd
- 17610 Village Dr
- 17601 Lake Shore Dr
- 10129 Longhorn Skyway
- 18009 Linkhill Dr
- 0 Westward Look
- 10627 Lake Park Dr
- 18003 Linkhill Dr
- 10624 Lake Park Dr
- 10033 Longhorn Skyway
- 17503 Lake Shore Dr
- 18101 Hideaway Cove
- 18003 Hideaway Cove
- 18003 Hideaway Cove
- 18100 Hideaway Cove
- 18109 Hideaway Cove
- 18000 Hideaway Cove
- 10406 W Cave Loop
- 18125 Compass Cir
- 18000 Turkey Trot Trail
- 18201 Shepherds Corral
- 10600 W Cave Loop
- 18137 Compass Cir
- 18012 Turkey Trot Trail
- 17938 Turkey Trot Trail
- 10400 W Cave Loop
- 10949 W Cave Blvd
- 18001 Points East Ridge
- 18128 Compass Cir
- 10601 W Cave Loop
- 17932 Turkey Trot Trail