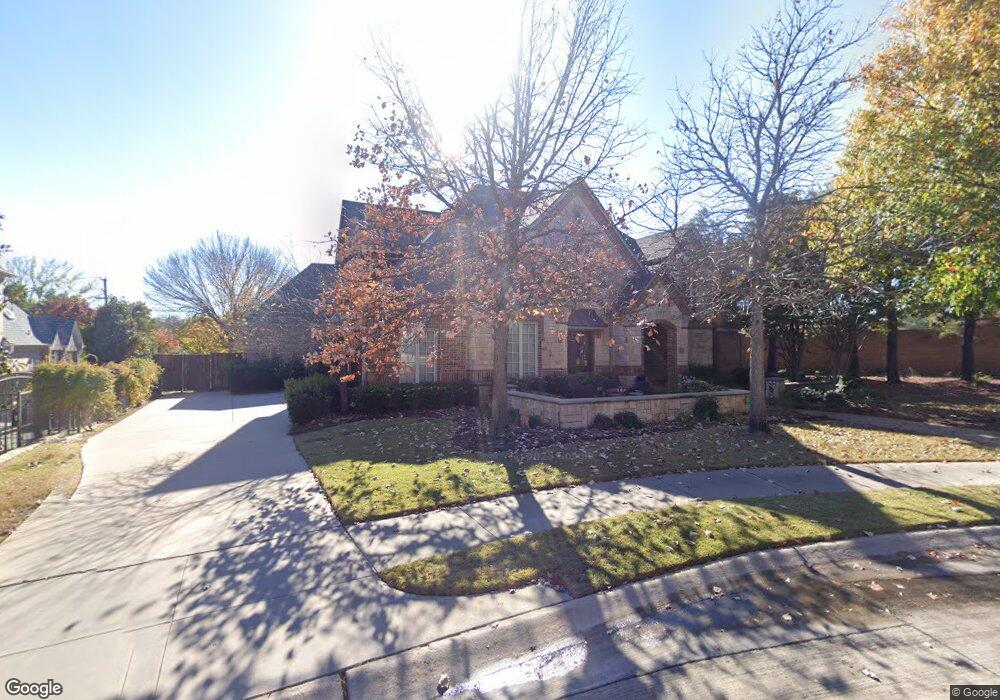
1801 Arrington Green Colleyville, TX 76034
Estimated Value: $1,157,378 - $1,591,000
5
Beds
5
Baths
4,381
Sq Ft
$308/Sq Ft
Est. Value
About This Home
This home is located at 1801 Arrington Green, Colleyville, TX 76034 and is currently estimated at $1,351,345, approximately $308 per square foot. 1801 Arrington Green is a home located in Tarrant County with nearby schools including Glenhope Elementary School, Cross Timbers Middle School, and Grapevine High School.
Ownership History
Date
Name
Owned For
Owner Type
Purchase Details
Closed on
Dec 11, 2023
Sold by
Texada Cyd
Bought by
Cyd Texada Living Trust and Texada
Current Estimated Value
Purchase Details
Closed on
Dec 19, 2014
Sold by
Rushin Lester and Rushin Jennelle
Bought by
Texada Ricy A
Home Financials for this Owner
Home Financials are based on the most recent Mortgage that was taken out on this home.
Original Mortgage
$417,000
Interest Rate
4.04%
Mortgage Type
Purchase Money Mortgage
Purchase Details
Closed on
May 2, 2005
Sold by
Broughton Lp
Bought by
Rushin Lester and Rushin Jennelle
Home Financials for this Owner
Home Financials are based on the most recent Mortgage that was taken out on this home.
Original Mortgage
$508,000
Interest Rate
6.06%
Mortgage Type
Construction
Create a Home Valuation Report for This Property
The Home Valuation Report is an in-depth analysis detailing your home's value as well as a comparison with similar homes in the area
Home Values in the Area
Average Home Value in this Area
Purchase History
| Date | Buyer | Sale Price | Title Company |
|---|---|---|---|
| Cyd Texada Living Trust | -- | None Listed On Document | |
| Texada Cyd | -- | None Listed On Document | |
| Texada Ricy A | -- | None Available | |
| Rushin Lester | -- | -- |
Source: Public Records
Mortgage History
| Date | Status | Borrower | Loan Amount |
|---|---|---|---|
| Previous Owner | Texada Ricy A | $417,000 | |
| Previous Owner | Rushin Lester | $508,000 | |
| Closed | Rushin Lester | $63,500 |
Source: Public Records
Tax History Compared to Growth
Tax History
| Year | Tax Paid | Tax Assessment Tax Assessment Total Assessment is a certain percentage of the fair market value that is determined by local assessors to be the total taxable value of land and additions on the property. | Land | Improvement |
|---|---|---|---|---|
| 2025 | $4,230 | $883,169 | $170,000 | $713,169 |
| 2024 | $4,230 | $1,039,023 | $170,000 | $869,023 |
| 2023 | $15,510 | $1,318,114 | $170,000 | $1,148,114 |
| 2022 | $17,918 | $950,000 | $170,000 | $780,000 |
| 2021 | $17,674 | $804,800 | $200,000 | $604,800 |
| 2020 | $18,242 | $820,942 | $200,000 | $620,942 |
| 2019 | $17,802 | $770,000 | $200,000 | $570,000 |
| 2018 | $4,503 | $757,460 | $175,000 | $582,460 |
| 2017 | $16,268 | $736,127 | $125,000 | $611,127 |
| 2016 | $14,789 | $626,000 | $125,000 | $501,000 |
| 2015 | $16,645 | $585,000 | $125,000 | $460,000 |
| 2014 | $16,645 | $726,800 | $125,000 | $601,800 |
Source: Public Records
Map
Nearby Homes
- 5613 Versailles Ct
- 5508 Coventry Ct
- 1813 Grosvenor Green
- Lot 4 Amelia Ct
- 5404 Miramar Ln
- 5504 Sycamore Dr
- 1509 Tinker Rd
- 5317 Bluebonnet Dr
- 6005 Valentino Ct
- 1512 Four Seasons Dr
- 1315 Hardage Ln
- 2008 Kyle Ct
- 1521 Four Seasons Dr
- 1505 Four Seasons Dr
- 1504 Four Seasons Dr
- 1533 Four Seasons Dr
- 1536 Four Seasons Dr
- 1513 Four Seasons Dr
- Lot 3 Amelia Ct
- 1517 Four Seasons Dr
- 1805 Arrington Green
- 1809 Arrington Green
- 1800 Arrington Green
- 1804 Arrington Green
- 1712 Gatehouse Ct
- 1808 Arrington Green
- 1708 Gatehouse Ct
- 5700 Normandy Dr
- 1812 Arrington Green
- 1801 Stratton Green
- 1704 Gatehouse Ct
- 1805 Stratton Green
- 1716 Gatehouse Ct
- 1809 Stratton Green
- 1700 Gatehouse Ct
- 1905 Hall Johnson Rd
- 1813 Stratton Green
- 5608 Normandy Dr
- 1713 Gatehouse Ct
- 5616 Coventry Ct