Estimated Value: $52,000 - $87,000
2
Beds
1
Bath
858
Sq Ft
$82/Sq Ft
Est. Value
About This Home
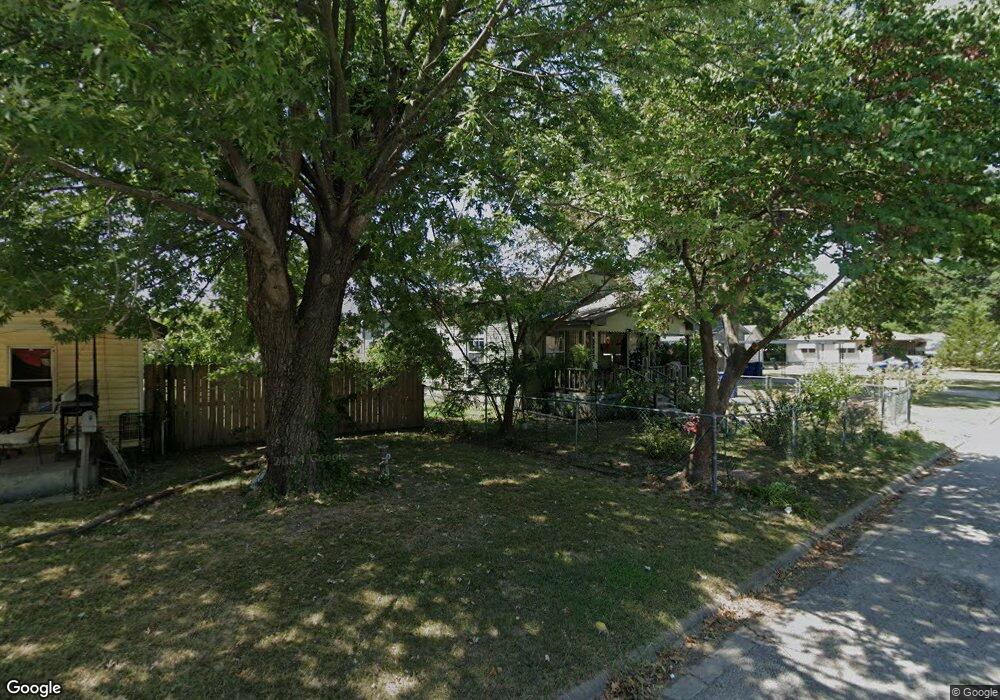
This home is located at 1801 B St NE, Miami, OK 74354 and is currently estimated at $70,410, approximately $82 per square foot. 1801 B St NE is a home located in Ottawa County with nearby schools including Miami High School and Mt. Olive Lutheran School.
Ownership History
Date
Name
Owned For
Owner Type
Purchase Details
Closed on
Jun 13, 2023
Sold by
Good Scott C
Bought by
Good Joel David
Current Estimated Value
Purchase Details
Closed on
Sep 7, 2016
Sold by
Good Joe Emmitt
Bought by
Good Scott C
Purchase Details
Closed on
Oct 12, 2012
Sold by
Good Judith Gayle and Good Joe Emmitt
Bought by
Good Joe Emmitt
Purchase Details
Closed on
Apr 7, 2009
Sold by
Freeze Linda K
Bought by
Thurman Audra Pauline and Good Judith Gail
Purchase Details
Closed on
Jan 5, 1995
Sold by
Freeze Doanld L and Freeze Linda K
Bought by
Freeze Linda K
Purchase Details
Closed on
May 2, 1994
Bought by
Freeze Donald L and Freeze Linda
Create a Home Valuation Report for This Property
The Home Valuation Report is an in-depth analysis detailing your home's value as well as a comparison with similar homes in the area
Home Values in the Area
Average Home Value in this Area
Purchase History
| Date | Buyer | Sale Price | Title Company |
|---|---|---|---|
| Good Joel David | -- | None Listed On Document | |
| Good Scott C | -- | None Available | |
| Good Joe Emmitt | -- | None Available | |
| Thurman Audra Pauline | $23,000 | Photo Abstarct Co | |
| Freeze Linda K | -- | None Available | |
| Freeze Donald L | $12,000 | -- |
Source: Public Records
Tax History Compared to Growth
Tax History
| Year | Tax Paid | Tax Assessment Tax Assessment Total Assessment is a certain percentage of the fair market value that is determined by local assessors to be the total taxable value of land and additions on the property. | Land | Improvement |
|---|---|---|---|---|
| 2025 | $522 | $4,996 | $570 | $4,426 |
| 2024 | $522 | $5,418 | $570 | $4,848 |
| 2023 | $522 | $5,203 | $566 | $4,637 |
| 2022 | $458 | $4,955 | $560 | $4,395 |
| 2021 | $446 | $4,719 | $554 | $4,165 |
| 2020 | $428 | $4,495 | $549 | $3,946 |
| 2019 | $352 | $4,281 | $536 | $3,745 |
| 2018 | $354 | $4,281 | $536 | $3,745 |
| 2017 | $360 | $4,281 | $536 | $3,745 |
| 2016 | $256 | $3,187 | $437 | $2,750 |
| 2015 | $190 | $2,140 | $398 | $1,742 |
| 2014 | $249 | $3,035 | $344 | $2,691 |
Source: Public Records
Map
Nearby Homes