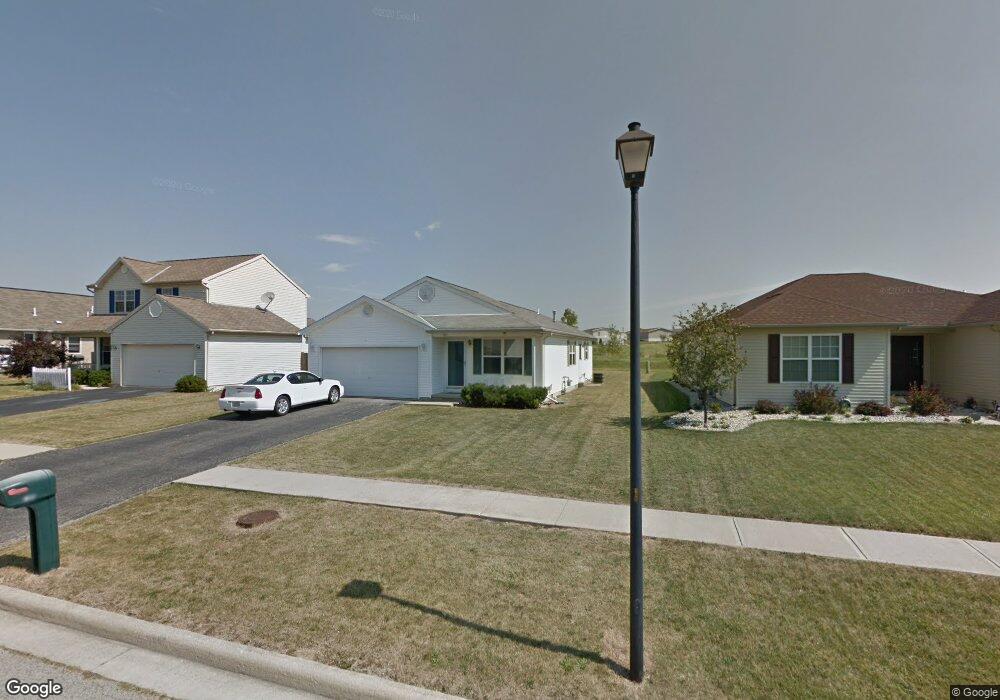
1801 Bishop Ln Findlay, OH 45840
Estimated Value: $175,000 - $191,000
3
Beds
1
Bath
956
Sq Ft
$194/Sq Ft
Est. Value
About This Home
This home is located at 1801 Bishop Ln, Findlay, OH 45840 and is currently estimated at $185,468, approximately $194 per square foot. 1801 Bishop Ln is a home located in Hancock County with nearby schools including Whittier Primary School, Bigelow Hill Elementary School, and Glenwood Middle School.
Ownership History
Date
Name
Owned For
Owner Type
Purchase Details
Closed on
Feb 19, 2002
Sold by
Arn Frederick N
Bought by
Snyder Jeffrey L
Current Estimated Value
Home Financials for this Owner
Home Financials are based on the most recent Mortgage that was taken out on this home.
Original Mortgage
$99,000
Outstanding Balance
$41,427
Interest Rate
7.23%
Mortgage Type
New Conventional
Estimated Equity
$144,041
Purchase Details
Closed on
Oct 22, 2001
Sold by
Rankins John M
Bought by
Arn Frederick and Arn Betty L
Home Financials for this Owner
Home Financials are based on the most recent Mortgage that was taken out on this home.
Original Mortgage
$95,000
Interest Rate
6.92%
Mortgage Type
New Conventional
Purchase Details
Closed on
Jan 29, 1998
Sold by
Ridge Krystal
Bought by
Rankins John
Home Financials for this Owner
Home Financials are based on the most recent Mortgage that was taken out on this home.
Original Mortgage
$83,125
Interest Rate
7.16%
Mortgage Type
New Conventional
Create a Home Valuation Report for This Property
The Home Valuation Report is an in-depth analysis detailing your home's value as well as a comparison with similar homes in the area
Home Values in the Area
Average Home Value in this Area
Purchase History
| Date | Buyer | Sale Price | Title Company |
|---|---|---|---|
| Snyder Jeffrey L | $99,000 | -- | |
| Arn Frederick | $95,000 | -- | |
| Rankins John | $87,698 | -- |
Source: Public Records
Mortgage History
| Date | Status | Borrower | Loan Amount |
|---|---|---|---|
| Open | Snyder Jeffrey L | $99,000 | |
| Previous Owner | Arn Frederick | $95,000 | |
| Previous Owner | Rankins John | $83,125 |
Source: Public Records
Tax History Compared to Growth
Tax History
| Year | Tax Paid | Tax Assessment Tax Assessment Total Assessment is a certain percentage of the fair market value that is determined by local assessors to be the total taxable value of land and additions on the property. | Land | Improvement |
|---|---|---|---|---|
| 2024 | $1,697 | $47,780 | $6,700 | $41,080 |
| 2023 | $1,700 | $47,780 | $6,700 | $41,080 |
| 2022 | $1,694 | $47,780 | $6,700 | $41,080 |
| 2021 | $1,642 | $40,330 | $6,710 | $33,620 |
| 2020 | $1,641 | $40,330 | $6,710 | $33,620 |
| 2019 | $1,608 | $40,330 | $6,710 | $33,620 |
| 2018 | $1,524 | $35,070 | $5,830 | $29,240 |
| 2017 | $1,525 | $35,070 | $5,830 | $29,240 |
| 2016 | $1,509 | $35,070 | $5,830 | $29,240 |
| 2015 | $918 | $20,990 | $4,800 | $16,190 |
| 2014 | $918 | $20,990 | $4,800 | $16,190 |
| 2012 | $1,176 | $26,680 | $4,800 | $21,880 |
Source: Public Records
Map
Nearby Homes
- 1865 Breckenridge Rd
- 1736 Woodridge Crescent
- 0 Sheridan Ave
- 1928 Deer Ridge Dr
- 1928 Deer Ridge Dr Unit L-133
- 1062 Vincent St
- 1474 Southwood Ave
- 1216 Concord Ct
- 0 E Melrose Ave
- 1010 Brenda Ct
- 715 Christina Ct
- 1908 Gayle Ln
- 600 Charles Ave
- 716 Winfield Ave
- 0 Keith Pkwy Unit 6123798
- 0 Keith Pkwy Unit 20244552
- 0 Romick Pkwy Unit 6131435
- 0 Romick Pkwy Unit 6123797
- 0 Romick Pkwy Unit 20244553
- 1450 Fostoria Ave
- 1795 Bishop Ln
- 1815 Bishop Ln
- 1775 Bishop Ln
- 0 Bishop Ln Unit 20161023
- 0 Bishop Ln Unit 5099716
- 0 Bishop Ln Unit H131967
- 0 Bishop Ln Unit H113127
- 0 Bishop Ln Unit 140080
- 1825 Bishop Ln
- 1800 Bishop Ln
- 1115 Sheridan Ave
- 1835 Bishop Ln
- 1830 Bishop Ln
- 1845 Bishop Ln
- 1110 Sheridan Ave
- 1770 Bishop Ln
- 1860 Breckenridge Rd
- 1840 Bishlop