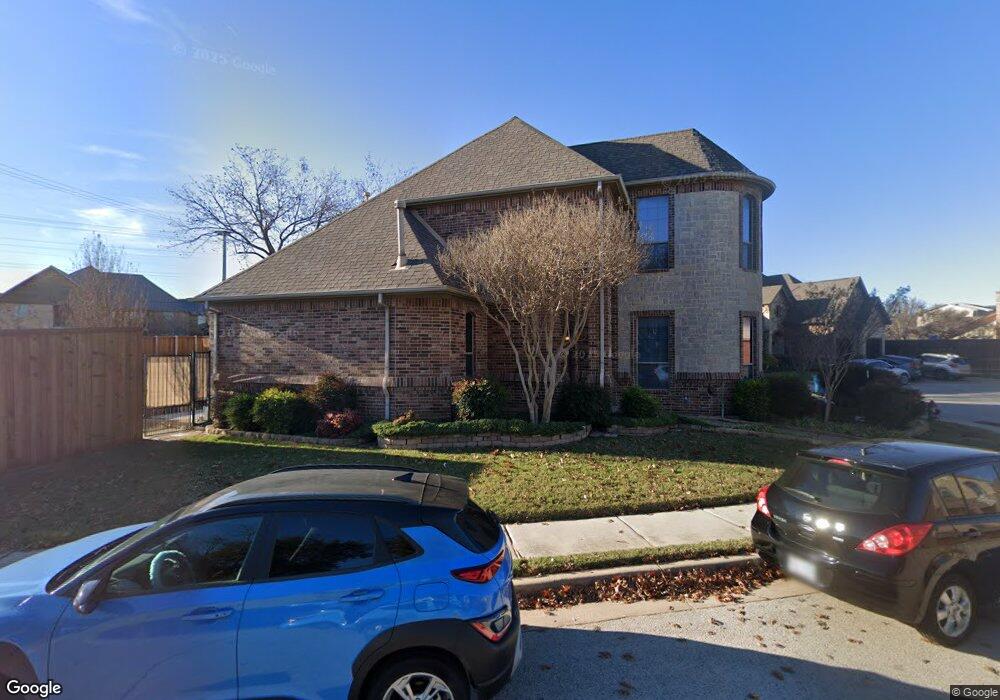
1801 Castle Ct Grapevine, TX 76051
Estimated Value: $564,389 - $932,000
4
Beds
3
Baths
2,560
Sq Ft
$285/Sq Ft
Est. Value
About This Home
This home is located at 1801 Castle Ct, Grapevine, TX 76051 and is currently estimated at $728,847, approximately $284 per square foot. 1801 Castle Ct is a home located in Tarrant County with nearby schools including Jack D. Johnson Elementary, Don T. Durham Intermediate School, and Carroll Middle School.
Ownership History
Date
Name
Owned For
Owner Type
Purchase Details
Closed on
Feb 28, 2008
Sold by
Mcpherson Construction Inc
Bought by
Ittiruck Suwit and Ittiruck Supaporn
Current Estimated Value
Home Financials for this Owner
Home Financials are based on the most recent Mortgage that was taken out on this home.
Original Mortgage
$260,000
Outstanding Balance
$161,454
Interest Rate
5.68%
Mortgage Type
Purchase Money Mortgage
Estimated Equity
$567,393
Create a Home Valuation Report for This Property
The Home Valuation Report is an in-depth analysis detailing your home's value as well as a comparison with similar homes in the area
Home Values in the Area
Average Home Value in this Area
Purchase History
| Date | Buyer | Sale Price | Title Company |
|---|---|---|---|
| Ittiruck Suwit | -- | American Title |
Source: Public Records
Mortgage History
| Date | Status | Borrower | Loan Amount |
|---|---|---|---|
| Open | Ittiruck Suwit | $260,000 |
Source: Public Records
Tax History
| Year | Tax Paid | Tax Assessment Tax Assessment Total Assessment is a certain percentage of the fair market value that is determined by local assessors to be the total taxable value of land and additions on the property. | Land | Improvement |
|---|---|---|---|---|
| 2025 | $5,472 | $428,365 | $110,000 | $318,365 |
| 2024 | $5,472 | $470,000 | $110,000 | $360,000 |
| 2023 | $7,719 | $440,050 | $110,000 | $330,050 |
| 2022 | $8,615 | $421,385 | $110,000 | $311,385 |
| 2021 | $8,166 | $410,000 | $110,000 | $300,000 |
| 2020 | $7,476 | $410,000 | $110,000 | $300,000 |
| 2019 | $7,081 | $410,000 | $110,000 | $300,000 |
| 2018 | $5,270 | $284,365 | $110,000 | $174,365 |
| 2017 | $5,961 | $258,514 | $70,000 | $188,514 |
| 2016 | $5,961 | $258,514 | $70,000 | $188,514 |
| 2015 | $5,794 | $258,991 | $25,000 | $233,991 |
| 2014 | $5,794 | $260,219 | $25,000 | $235,219 |
Source: Public Records
Map
Nearby Homes
- 2941 Kosse Ct
- 2940 Kosse Ct
- 2976 Kosse Ct
- 2977 Kosse Ct
- 2947 Kosse Ct
- 2964 Kosse Ct
- 2970 Kosse Ct
- 2080 E Dove Rd Unit Lot 4
- 2080 E Dove Rd Unit Lot 2
- 2080 E (Lot 1) Dove Rd
- 2080 E Dove Rd Unit Lot 6
- 2716 Summer Wind Dr
- 1963 E Dove Rd
- 2807 Stonehurst Dr
- TBD Sunshine Ln
- 2924 Scenic Dr
- 1459 Sunshine Ln
- 1032 Hatch Ct
- 2954 Trail Lake Dr
- 2800 Springbranch Ct
- 1808 Castle Ct
- 1805 Castle Ct
- 1804 Castle Ct
- 1812 Castle Ct
- 1809 Castle Ct
- 1800 Castle Ct
- 1816 Castle Ct
- 2108 N Kimball Ave
- 2015 Harwell St
- 2011 Harwell St
- 2019 Harwell St
- 2007 Harwell St
- 1500 N Kimball Ave
- 2027 Harwell St
- 2114 N Kimball Ave
- 2318 Kimball Glen Ct
- 2029 Harwell St
- 1620 N Kimball Ave
- 2014 Harwell St
- 2334 Kimball Glen Ct
Your Personal Tour Guide
Ask me questions while you tour the home.