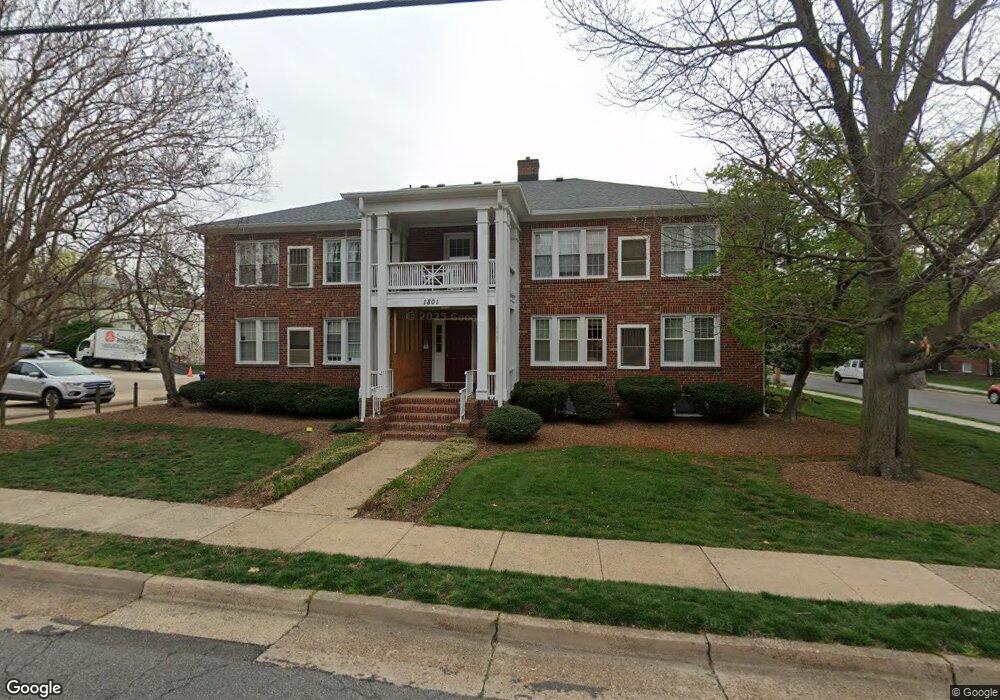
1801 Dewitt Ave Unit B Alexandria, VA 22301
Del Ray NeighborhoodEstimated Value: $242,620 - $302,000
1
Bed
1
Bath
438
Sq Ft
$603/Sq Ft
Est. Value
About This Home
This home is located at 1801 Dewitt Ave Unit B, Alexandria, VA 22301 and is currently estimated at $264,155, approximately $603 per square foot. 1801 Dewitt Ave Unit B is a home located in Alexandria City with nearby schools including Mount Vernon Community School, George Washington Middle School, and Alexandria City High School.
Ownership History
Date
Name
Owned For
Owner Type
Purchase Details
Closed on
Mar 31, 2022
Sold by
Bennett Garner R and Bennett Claire B
Bought by
Ungar David Benjamin
Current Estimated Value
Home Financials for this Owner
Home Financials are based on the most recent Mortgage that was taken out on this home.
Original Mortgage
$179,010
Outstanding Balance
$146,756
Interest Rate
3.83%
Mortgage Type
New Conventional
Estimated Equity
$117,399
Purchase Details
Closed on
Aug 22, 2003
Sold by
Parisi Jose
Bought by
Bennett Garner
Home Financials for this Owner
Home Financials are based on the most recent Mortgage that was taken out on this home.
Original Mortgage
$84,000
Interest Rate
5.52%
Mortgage Type
New Conventional
Purchase Details
Closed on
Sep 2, 1994
Sold by
Alex Square Assoc
Bought by
Woon Melanie A
Home Financials for this Owner
Home Financials are based on the most recent Mortgage that was taken out on this home.
Original Mortgage
$48,800
Interest Rate
8.44%
Mortgage Type
Purchase Money Mortgage
Create a Home Valuation Report for This Property
The Home Valuation Report is an in-depth analysis detailing your home's value as well as a comparison with similar homes in the area
Home Values in the Area
Average Home Value in this Area
Purchase History
| Date | Buyer | Sale Price | Title Company |
|---|---|---|---|
| Ungar David Benjamin | $212,000 | Chicago Title | |
| Bennett Garner | $112,000 | -- | |
| Woon Melanie A | $61,000 | -- |
Source: Public Records
Mortgage History
| Date | Status | Borrower | Loan Amount |
|---|---|---|---|
| Open | Ungar David Benjamin | $179,010 | |
| Previous Owner | Woon Melanie A | $84,000 | |
| Previous Owner | Woon Melanie A | $48,800 |
Source: Public Records
Tax History
| Year | Tax Paid | Tax Assessment Tax Assessment Total Assessment is a certain percentage of the fair market value that is determined by local assessors to be the total taxable value of land and additions on the property. | Land | Improvement |
|---|---|---|---|---|
| 2025 | $3,003 | $256,748 | $80,674 | $176,074 |
| 2024 | $3,003 | $256,748 | $80,674 | $176,074 |
| 2023 | $2,850 | $256,748 | $80,674 | $176,074 |
| 2022 | $2,545 | $229,239 | $72,030 | $157,209 |
| 2021 | $2,545 | $229,239 | $72,030 | $157,209 |
| 2020 | $2,568 | $229,239 | $72,030 | $157,209 |
| 2019 | $2,467 | $218,323 | $68,600 | $149,723 |
| 2018 | $2,327 | $205,965 | $64,717 | $141,248 |
| 2017 | $2,260 | $199,966 | $62,832 | $137,134 |
| 2016 | $2,146 | $199,966 | $62,832 | $137,134 |
| 2015 | $1,986 | $190,444 | $59,840 | $130,604 |
| 2014 | $1,986 | $190,444 | $59,840 | $130,604 |
Source: Public Records
Map
Nearby Homes
- 217 Duncan Ave Unit A
- 1700 Dewitt Ave
- 1800 Mount Vernon Ave Unit 207
- 1800 Mount Vernon Ave Unit 306
- 2100 Mount Vernon Ave
- 304 E Nelson Ave
- 527 E Duncan Ave
- 565 E Nelson Ave
- 2406 Leslie Ave
- 1 E Custis Ave
- 1417 van Valkenburgh Ln
- 106 E Oxford Ave
- 2403 Burke Ave
- 2205 E Randolph Ave
- 2305 Commonwealth Ave
- 520 E Mount Ida Ave
- 1901 Main Line Blvd Unit 102
- 2102 Main Line Blvd
- 2215 Richmond Hwy Unit 101
- 14 W Bellefonte Ave
- 1801 Dewitt Ave Unit E
- 1801 Dewitt Ave
- 1801 Dewitt Ave Unit F
- 1801 Dewitt Ave Unit H
- 1801 Dewitt Ave Unit G
- 1801 Dewitt Ave
- 1801 Dewitt Ave Unit C
- 1801 Dewitt Ave Unit A
- 1801 Dewitt Ave Unit D
- 1801 Dewitt Ave Unit 1801-A
- 1801 Dewitt Ave Unit 1801D
- 1801 Dewitt Ave Unit 1801-E
- 1801 Dewitt Avenue D Unit D
- 304 E Duncan Ave Unit E
- 304 E Duncan Ave Unit G
- 304 E Duncan Ave Unit C
- 304 E Duncan Ave Unit F
- 304 E Duncan Ave Unit H
- 304 E Duncan Ave
- 304 E Duncan Ave Unit B
Your Personal Tour Guide
Ask me questions while you tour the home.